Coronavirus: A Market Health-Check
Coronavirus: A Market Health-Check
Leo Varadkar’s Washington D.C. address to the nation may feel an eternity ago, but it has been just over 4 weeks since schools were closed, gatherings limited and the global COVID-19 pandemic began to feel real. In the background, the Irish electricity system has continued to operate – and with increased reliance from medical centres and the workforce working from home, the requisite of security of supply has perhaps never been greater. Under this pressure, we investigate how the market has reacted to these extraordinary times.
Demand
There has been evidence across Europe of a reduction in electricity demand as a result of lockdown measures, and Ireland has been no different – but perhaps the decrease in demand has been overstated so far.
The Irish electricity demand for the last six weeks is shown in Fig. 1 and compared to the same period in 2018/2019 (and adjusted to match day of week). Firstly, there is significant demand variation evident in each year during this period as we transition from a dark, cold February to a brighter, warmer March. From March 13, demand has decreased – 10% lower compared to the three weeks previous, and from the introduction of the 2km travel limit demand has decreased by 12% – but compared to 2019 demand is only down 3% and 8% respectively for these two periods. In 2018 demand dropped by 7% after March 13. It is important to remember that, while demand has decreased, it always decreases at this time of year. Notwithstanding this, it is evident from the graph that demand over the last week in particularly has been noticeably below data from the previous two years, and perhaps this is the trend we are likely to continue along.
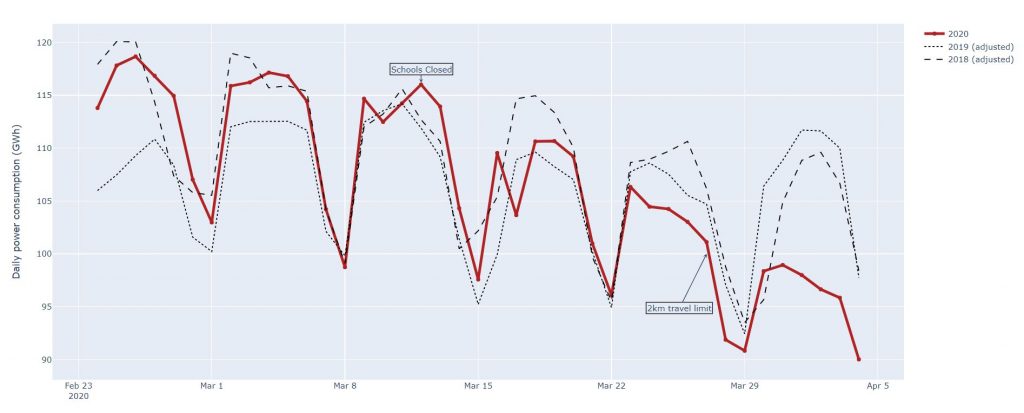
Fig. 1. Average Daily power consumption Feb 24 – Apr 4. (Note: 2019 and 2018 data shifted to match 2020 day of week)
Fig. 2 shows the average electricity demand in MW for each hour of the day since March 13 for 2020, 2019 and 2018. Additionally, the average 2020 Feb/Mar demand is also plotted. While as expected there is a material drop in demand now compared to the average Feb/Mar data, this difference is not as apparent when compared with the 2019 and 2018 data. However, when comparing with previous years there does appear to be some decrease in demand ahead of and during normal office hours with typically a 7% decrease during the mid-morning period.
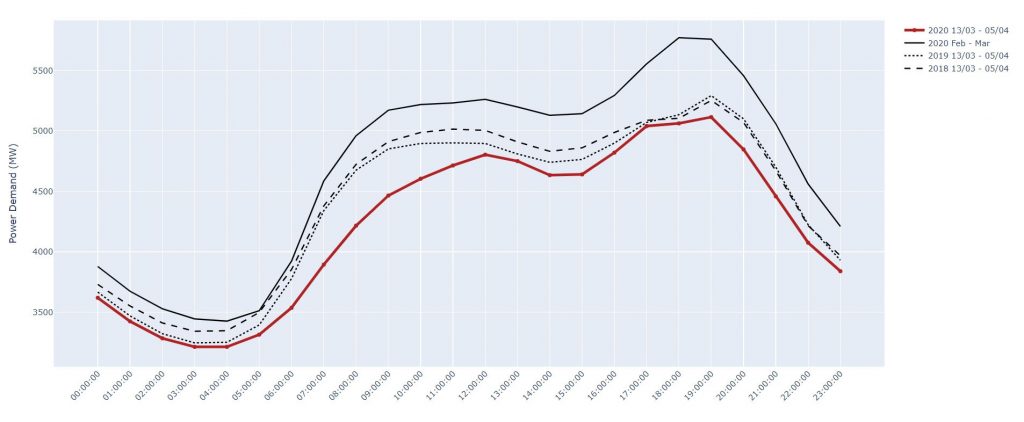
Fig. 2. Demand consumption average by hour of day
EirGrid’s usually accurate demand forecasts have been impacted – perhaps not surprising considering the uniqueness of the situation. Fig. 3 shows the average forecast percentage error for each hour of the day since March 13 (positive % indicates over-forecast). The tendency to over-forecast has increased. The largest error occurs close to the morning demand rise, around 08:00. With many people working from home, the usual rise in electricity demand associated with morning routine, commuting and beginning the working day in offices and schools is no longer present. Interestingly, the error has decreased between the hours of 23:00 and 01:00 – perhaps with pubs, concerts and other evening entertainment cancelled it has become easier to forecast when electricity demand is likely to come down for the night.
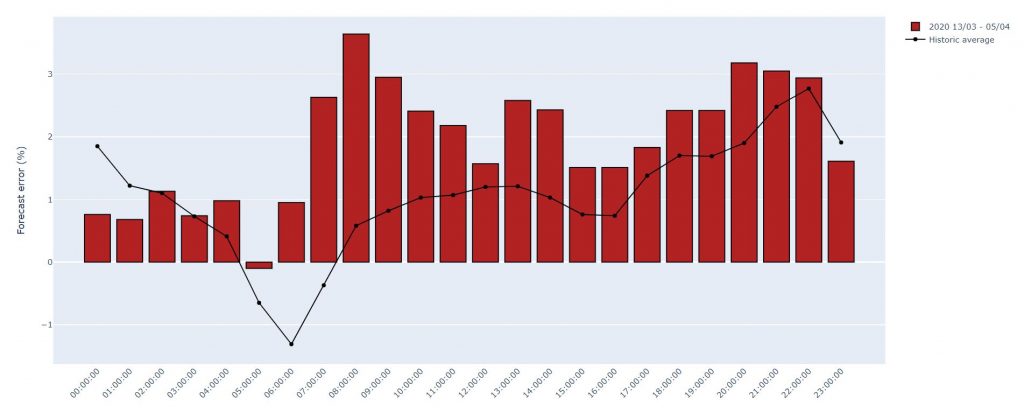
Fig. 3. Demand forecast percentage error on average for each hour of day
In summary, there appears to be some reduction in demand due to Coronavirus behavioural change particularly early in the day – however some of this change is caused by the normal seasonal demand reduction. More data will be needed to make firmer conclusions.
Market Prices
Fig. 4 shows the average day ahead and imbalance prices for each hour of the day since March 13, with the 2019 prices for the same period and average 2020 Feb/Mar prices shown for reference. As can be seen, prices are lower in both markets. Day ahead spot prices are down 9% and imbalance prices down 19% compared to the Feb/Mar average; they are down 32% and 46% respectively compared to 2019 over the same period. Market volatility is also down. There is a lot more at play here than simply a reduction in demand – the recent low oil and gas prices combined with healthy levels of wind generation over the last few weeks have primarily contributed to lower prices.
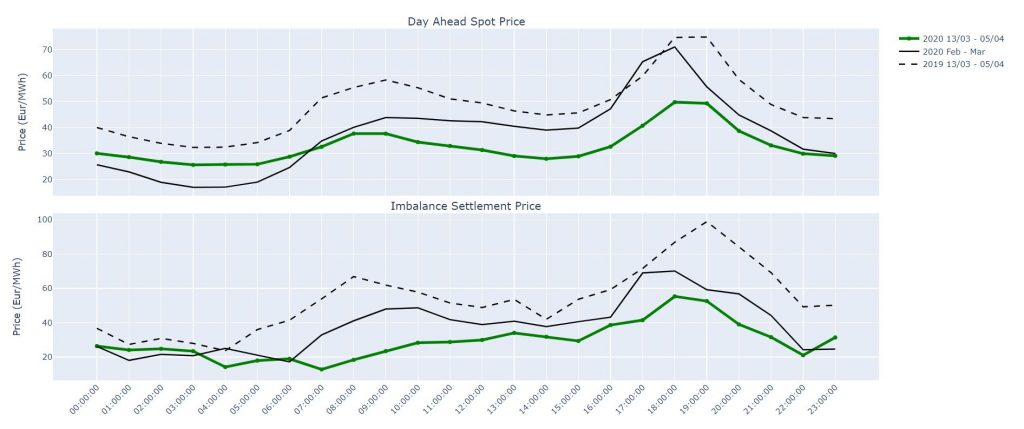
Fig. 4. Market Prices since closure of schools (March 13)
Carbon Dioxide Emissions
Reports of cleaner Chinese air and aquatic life returning to canals of Venice has resulted in commentators claiming that the only benefactor of this crisis could be planet Earth. As Fig. 5 shows though, there is little to suggest that there has been a beneficial impact on CO2 emissions from the generation of electricity in Ireland so far – in fact, emissions increased slightly on average over the study period. Of course, this is very much dependent on the availability of wind generation, and you would expect that as demand decreases CO2 emissions should too.
Regardless, electricity systems are unlikely to be the major cause of decreased emissions – transport and industry are more than likely the sectors which will see the largest reductions. In truth though, it may be best to simply ignore any emissions statistics during what is obviously a colossal anomaly in the data. The only impact of widespread praise for emission reductions this year would be complacency towards the issue of decarbonisation from politicians, engineers and the public – which would have catastrophic consequences in us reaching our 2030 targets.
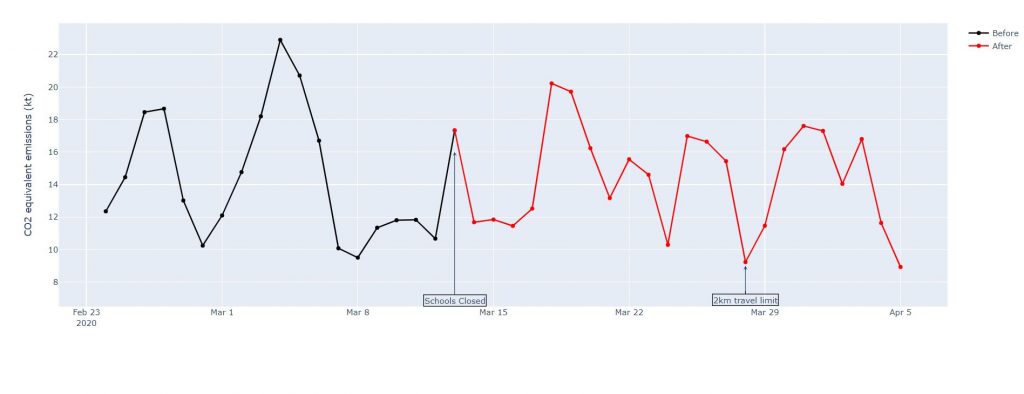
Fig. 5. Emissions from electricity generation (estimated using SEAI emission factors)
The full extent of how this crisis has impacted our electricity system, and livelihood, will likely only become clear after life has returned to some form of normality. For now, stay safe.
All market data obtained from SEMO.