2020 in LNG – A tale of two halves
2020 in LNG – A tale of two halves
Last year was a year like no other and while most will think of the world-wide pandemic or the Australian bush fires, those in energy circles will not forget the LNG market of 2020. A tale of two halves, the market moved from buyers cancelling LNG deliveries due to large oversupply, to LNG shipments being a worldwide scarcity. But what were the drivers behind the large shift? And where did it all begin?
Winter 2019 was mild and one of the warmest of both Europe and Asia in recent times. As Q1 2020 continued, the now infamous Covid-19 virus struck China, the second largest LNG demand hub in the world behind Japan, and left utilities throughout the country with an oversupply of the commodity due to Covid-19 related demand destruction and warm weather. CNOOC, the largest importer of LNG in China, declared Force Majeure and refused to accept cargoes from across the globe due to concerns over the spread of the virus. While some suppliers such as Total SA rejected the Force Majeure, it set precedent for several of the world’s largest importers to follow suit with India declaring Force Majeure not long after. LNG tankers en-route to China were diverted while others idled offshore. Covid-19 was the final straw for tumbling global gas markets which had struggled to find support due to the warm Winter and plentiful supply.
Come the Summer months, forward contracts in Europe were falling towards the 10€/MWh mark. US crude oil (WTI) made global headlines as the May contract turned negative on expiry due to storages hitting tank tops and traders closing their physical positions. US upstream shut-ins became inevitable. One by one, rigs across the US closed and production came to a standstill. In March 2020, the Baker Hughes drill-rig count showed 682 rigs in production. Come June that number fell to 172, a drop of 75%. This had a colossal influence on the US gas market due to the large amount of associated gas produced in US oil rigs. As US gas rallied and European and Asian markets continued to fall, US LNG suppliers felt the pinch as arbitrages closed and LNG exports became unprofitable. This trend continued throughout the Summer and cancelled shipments from the US became a common occurrence with up to 45 cargoes a month being declined.
August was the start of a shift towards what would be a Winter of volatility across global energy markets on the back of what was happening in the LNG sphere. Hurricane season in the US Gulf Coast came with furor and was making records for the number and intensity of storms which would hit. Hurricane Laura and Marco amongst others would be the most notable and lead to shut downs and damage to three of the largest LNG liquefaction facilities in the world; Sabine Pass, Corpus Christi and Cameron. Sabine Pass, the largest of the plants, which has the capacity to export up to 8 cargoes a week was brought to 0 from the 24th of August to the 10th of September after the damage caused by Hurricane Laura. This led to a backlog of vessels waiting to load LNG from the plant. This backlog was further exacerbated by none other than a sunken barge blocking one of the major access routes, the Calcasieu Ship Channel, for several days across September.
As September came to an end, the rate of vessels departing the Gulf loaded with LNG was increasing as production and infrastructure problems were solved. Delayed shipments were arriving to the Panama Canal simultaneously which led to the beginning of one of the main causes of sky-high Winter prices, the congestion of the Panama Canal.
The Panama Canal marks the main shipping route from the US to Asia and is by far the most cost-effective path. In an emailed statement, the Panama Canal Authority assigned the congestion to “a combination of higher-than-average arrivals, seasonal fog and added Covid-19 safety procedures”. Come the end of October the waiting time for vessels to enter the Panama Canal was reaching as much as 10 – 14 days. For reference, a typical trip from the US Gulf Coast to Tokyo, Japan would take 21 days. Trips were now taking a month, and that was only one-way. Shippers now began to send cargoes East from the US, around the Cape of Good Hope in Africa, and toward Asia to try and exploit the ever-growing Asian price.
The effect of the Panama Canal congestion could not be understated as vessels being tied up in 2-month round-trips led to record chartering rates. As October approached, demand recovery in Asian hubs was becoming evident. China had the quickest growing economy in the world and their LNG demand reflected this.
Asian premium over other world markets began to grow but it would now need to price in increasing chartering rates, longer travel times and competition from other Asian buyers.
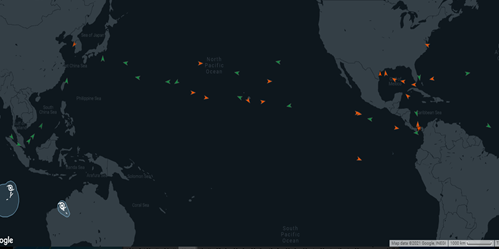
Fig 1 – A stream of LNG cargoes leave the US for Asia transiting the Panama Canal (Source; Kpler)
Whilst LNG demand recovery became clear, LNG supply was not on the same trajectory. Indonesia, Malaysia and Trinidad and Tobago amongst others all faced unplanned outages and production problems while a fire at the Hammerfest LNG plant in Norway meant a 12-month full shutdown.
In a final addition to what would be the perfect storm, Qatar, the largest LNG producer in the world, also faced production problems just as Winter demand came to fruition. Qatar also chose not to sub-let any of its’ spare LNG fleet, putting further upward pressure on shipping prices.
As the depths of Winter approached, the cold weather struck. Power market dynamics in Asia added to the increasing demand as South Korea decommissioned coal plants and Japan saw several nuclear plant outages. The number of LNG shipments travelling from the US to Asia by the Cape of Good Hope in November and December doubled year-on-year and the increased travel time led to further incremental bookings of spot shipping capacity with some reports stating that shippers were simply unable to secure any capacity in the tight market.
Towards the end of 2020, JKM disconnected from any fundamental markers. While freight and shipping rates had been setting the JKM price, spot prices for LNG were now escalating past any form of marginal costs related to increased freight rates. Driven by supply outages and scarce shipping availability the market struggled to find any form of price anchor and buyers were now willing to pay over 30$/MMBtu for spot tenders delivering in January.
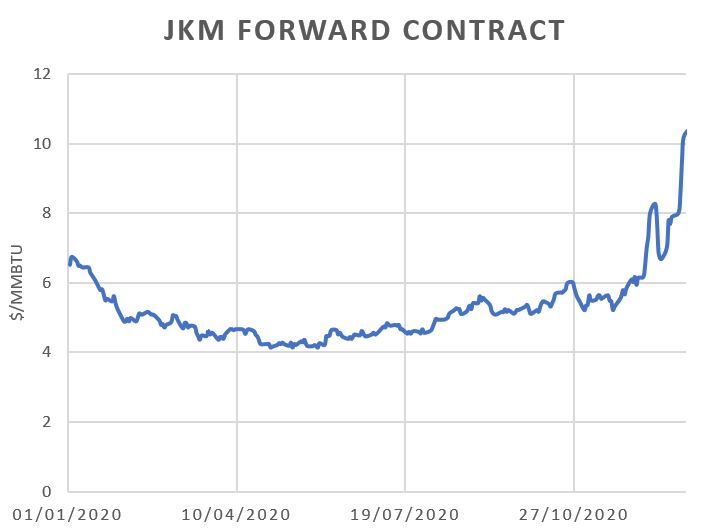
Fig 2 – JKM (Asian LNG marker) forward contract price; 01/01/20 – 31/12/20
The tightness in the LNG and shipping markets would lead to blowouts in several world energy markets across the globe from Japanese power which hit a baseload daily price of 154.57JPY/kWh (1236.56 €/MWh) and Spanish gas which hit 50 €/MWh for Day-Ahead delivery this January. It showed the integral role LNG now plays in not only worldwide gas hubs but power markets alike, in what is likely to be a long-standing relationship for the foreseeable future.
ElectroRoute actively trades on the main European Gas Hubs, including physical trading, and encompass a wide spectrum of activities supported by our internal trading platform which covers an end to end trading process for our clients. ElectroRoute can provide its clients with a range of route-to-market solutions which allows for different levels of revenue certainty, revenue potential and operational discretion.
For more information please contact clientservices@electroroute.com if you would like to explore this further.