Adapting to Opportunity: A first look at the impact of Schedule & Dispatch on BESS assets in the SEM
While Irelands DS3 Ancillary service market has been a resounding success at developing the storage industry in Ireland to over 1GW of power, by providing some of the highest returns for BESS assets in all of Europe, it is set to end over the next 18 months. In parallel, the development of longer duration BESS assets requires a greater emphasis on wholesale market participation. The increasingly larger batteries that have been installed on the system over the last couple of years have provided the dual benefit of being available for DS3 services as required, while now actively pursuing arbitrage trading opportunities. This has further fuelled the oversupply of fast acting DS3 services, promoting tariff reviews.
After a long 5 years of planning, consultation and testing, the Schedule & Dispatch (S&D) Programme began on the 13th of November 2025, partially with the intention of improving the ability of BESS assets to access arbitrage trading opportunities.
The S&D Programme now offers BESS assets their own registration category (previously BESS assets were registered as multi fuel generators, leaving obvious gaps in the operational range for storage) and crucially allowing the submission of negative Physical Notifications (PNs) for charging, enabling greater participation in the ex-ante markets. EirGrid has adopted a ‘follow PN’ approach for BESS assets, allowing traders to determine the optimal schedule for this asset class and mitigating the risk of units being moved away from their PN in the scheduling tools within the control centre. The System Operators have identified a select number of scenarios where the control centre may deviate from this approach.
While the implementation of S&D is still in its early days, this ElectroRoute Insight examines the initial difference in trading revenue pre and post the delivery of the S&D program.
Market Insight
This section provides market insight into the trading activity of all of the SEMO registered BESS assets on the island, comparing the 50-day periods either side of the start of S&D.
The volume traded across the different markets has increased considerably since the implementation of S&D with a 39% increase in sold volumes since the implementation of S&D.
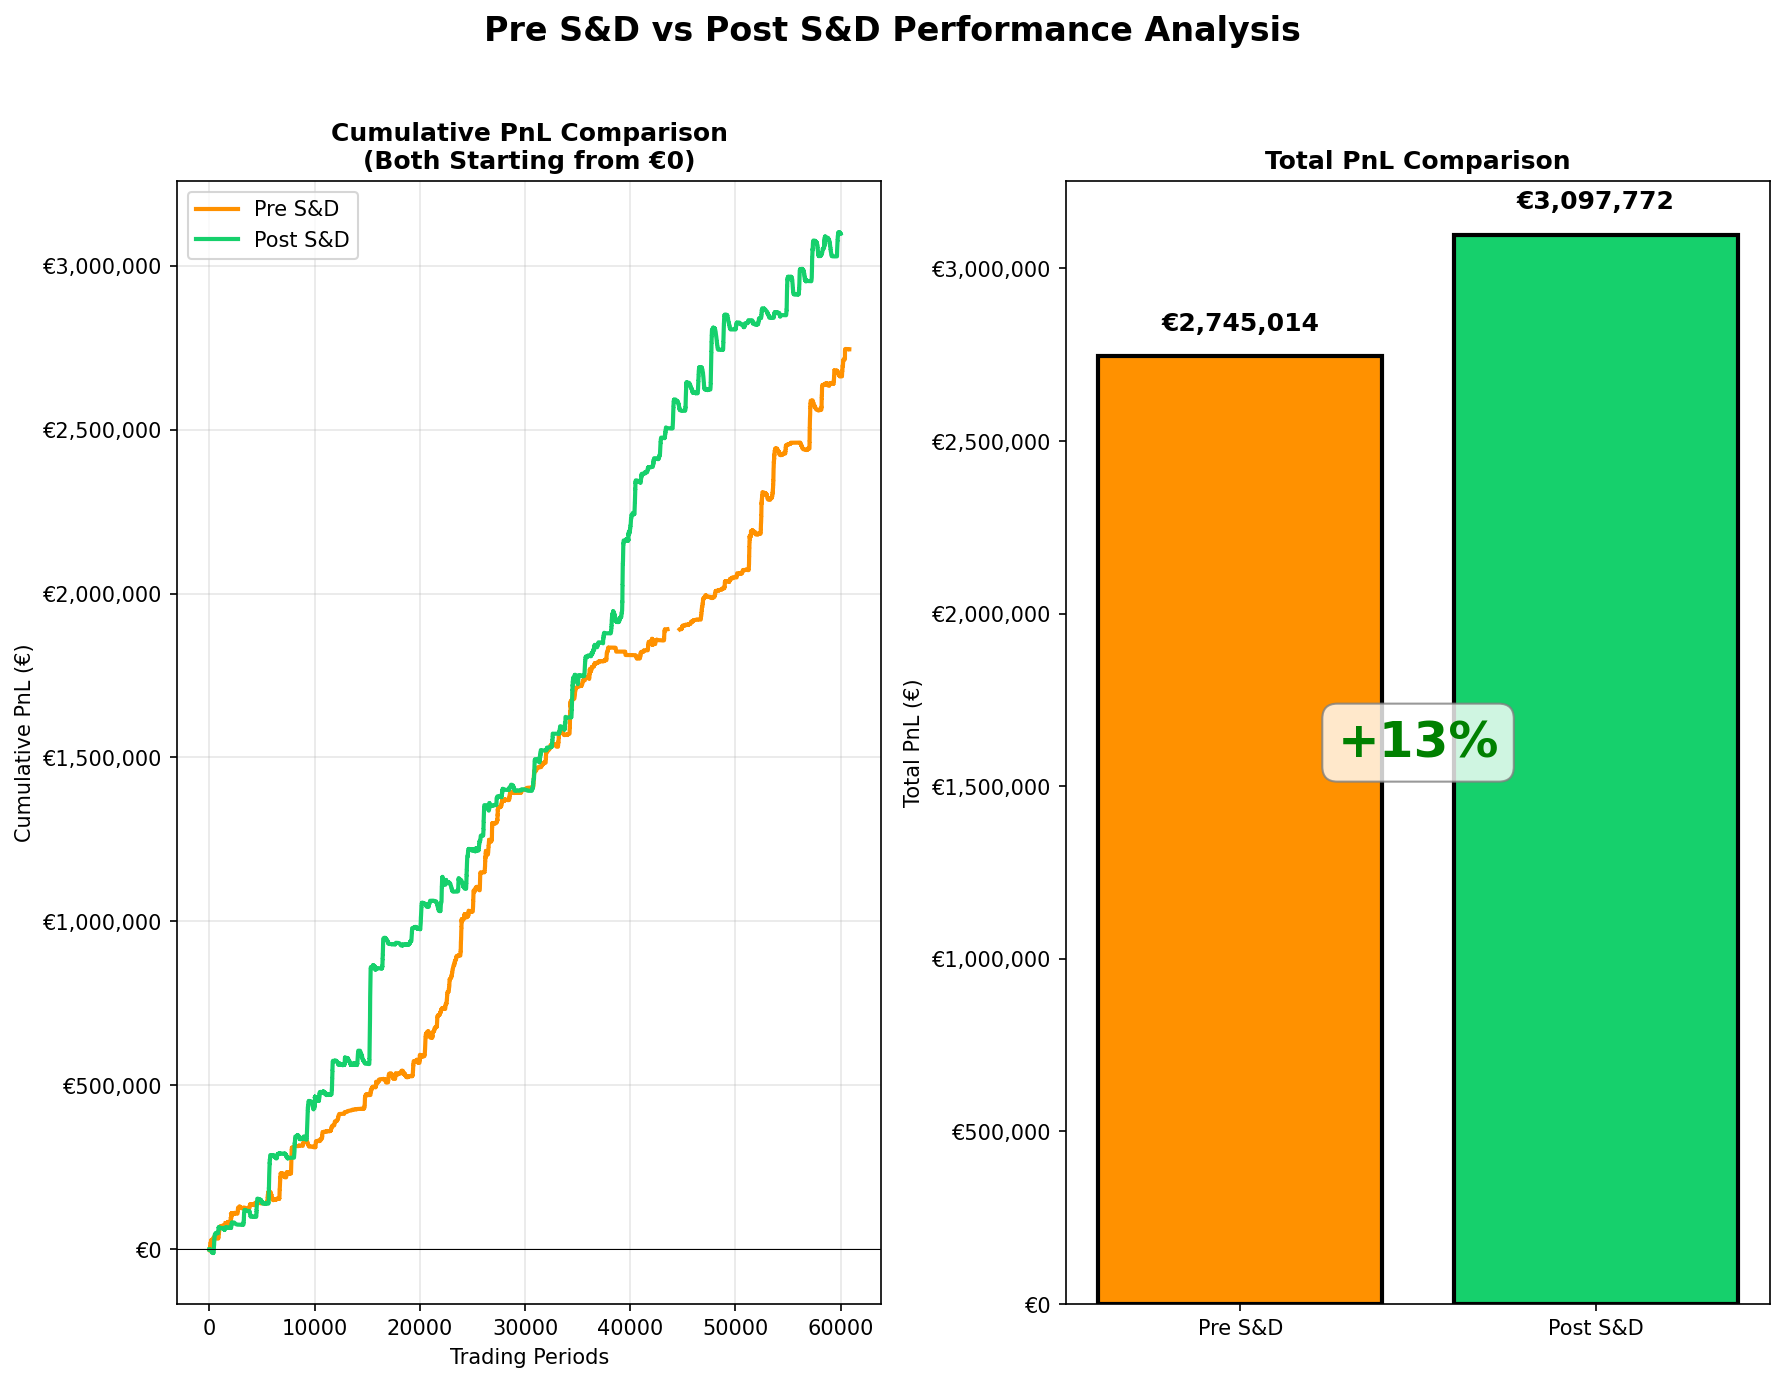
In the 50 days post the introduction of S&D, there is a marked difference in Trading PnL from the Wholesale and BM markets. There has been an estimated 13% increase in the accumulative trading profit across all BESS units. We have seen a stark improvement in Trading PnL over the last two weeks highlighting that owners, optimisers and EirGrid were adapting to the new systems.
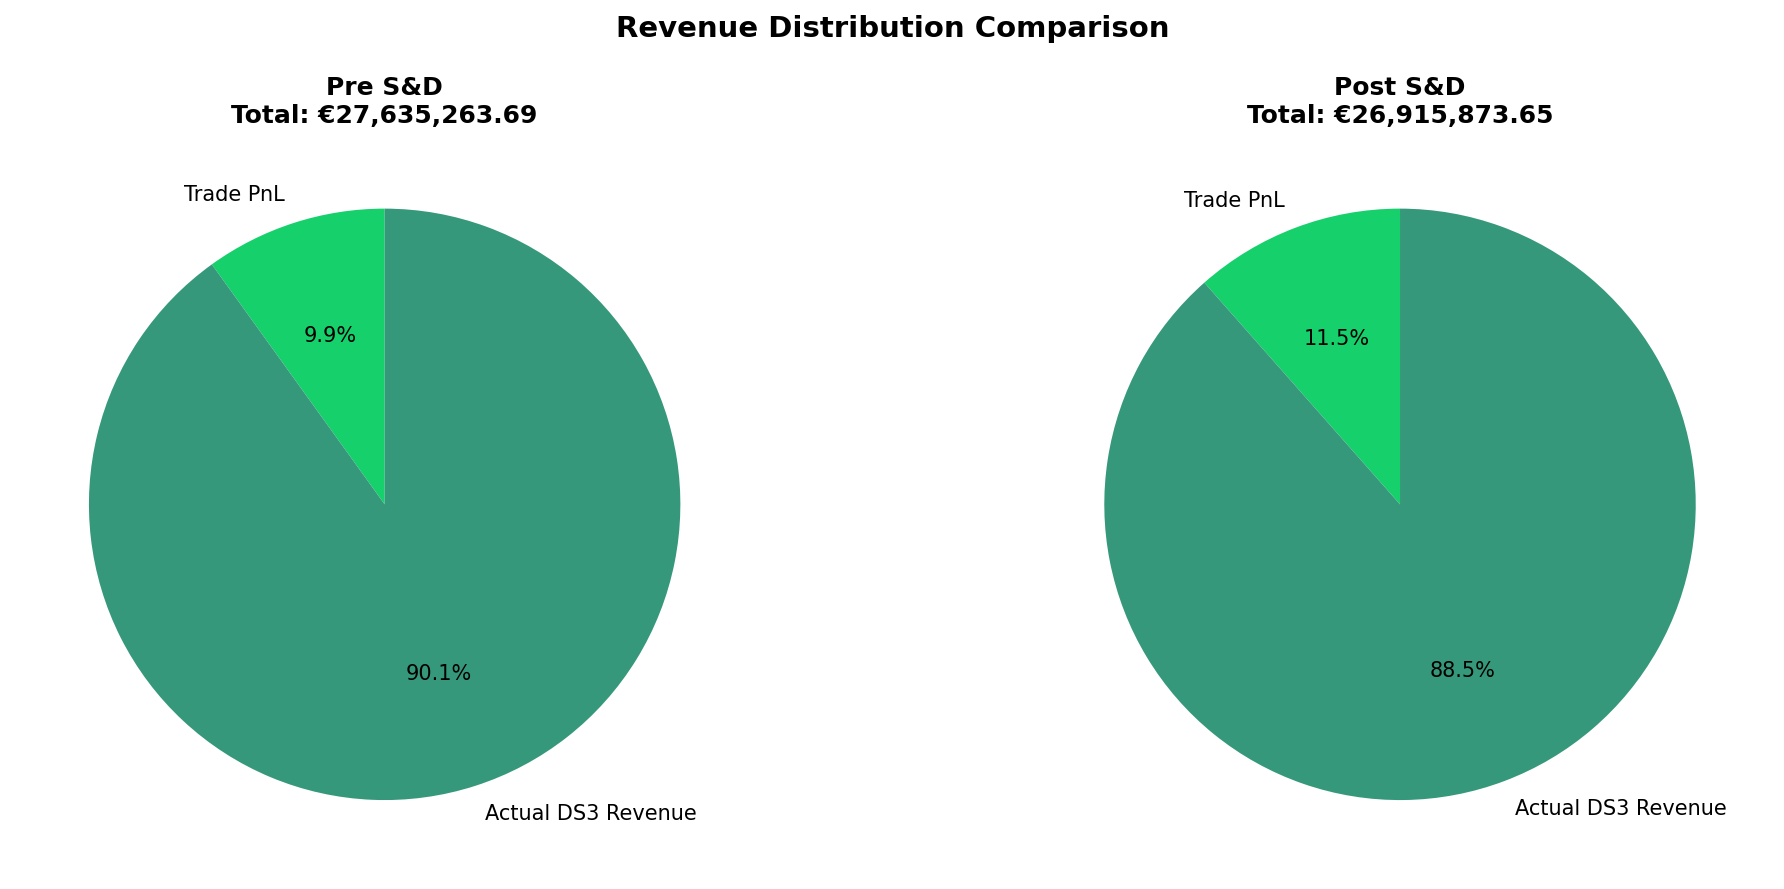
As expected, DS3 is still dominant in revenue – making up and average of 88.5% of revenue distribution for units during this period, only 1.6 percentage points less than the pre-S&D period, under similar system conditions.
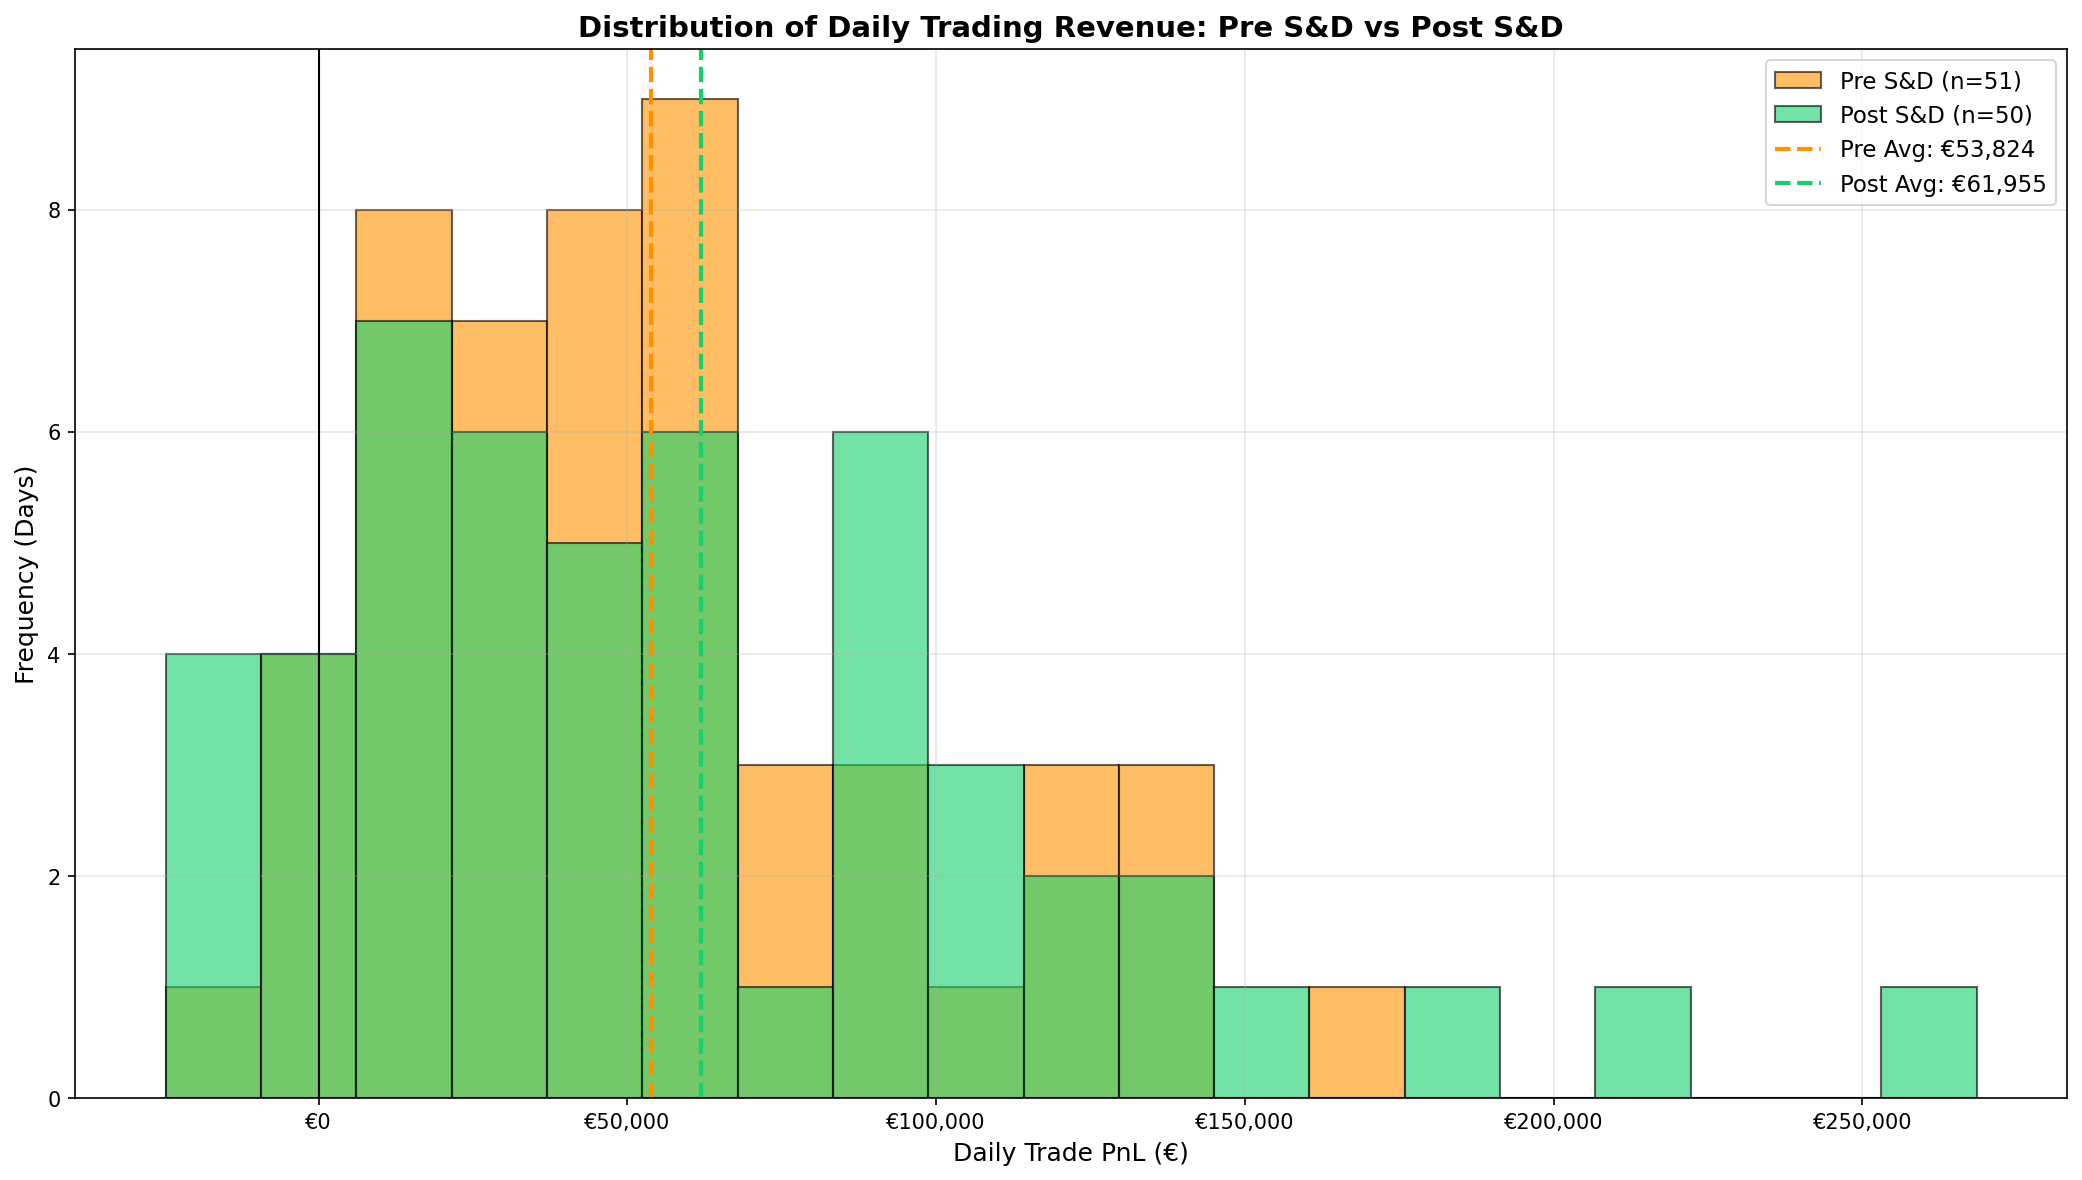
While there has been an increase in trading profit since the delivery of S&D, we see a greater variability in the day-to-day performance of the Trading PnL across the market, as can be seen below. While there have been some challenging trading days with limited spread opportunities, there has also been very favourable conditions for extended periods with volatile wholesale prices.
There has been a limited number of days where the BESS market had an accumulative negative Trade PnL. Days with low, or negative Trade PnL should not be viewed as a failure of trading, but as the flexibility of the market when DS3 revenues are strong. Several of the negative trading days were days of high SNSP, or followed by a sustained period of high SNSP, resulting in assets ensuring they had a healthy state of charge to meet DS3 obligations. There were also quiet days over the Christmas period, with less activity from some assets despite favourable conditions.
The most lucrative days since the delivery of S&D have come unsurprisingly on days when SNSP was low and wholesale prices were high. The lower SNSP resulted in an increased focus on arbitrage trading, with lucrative returns.
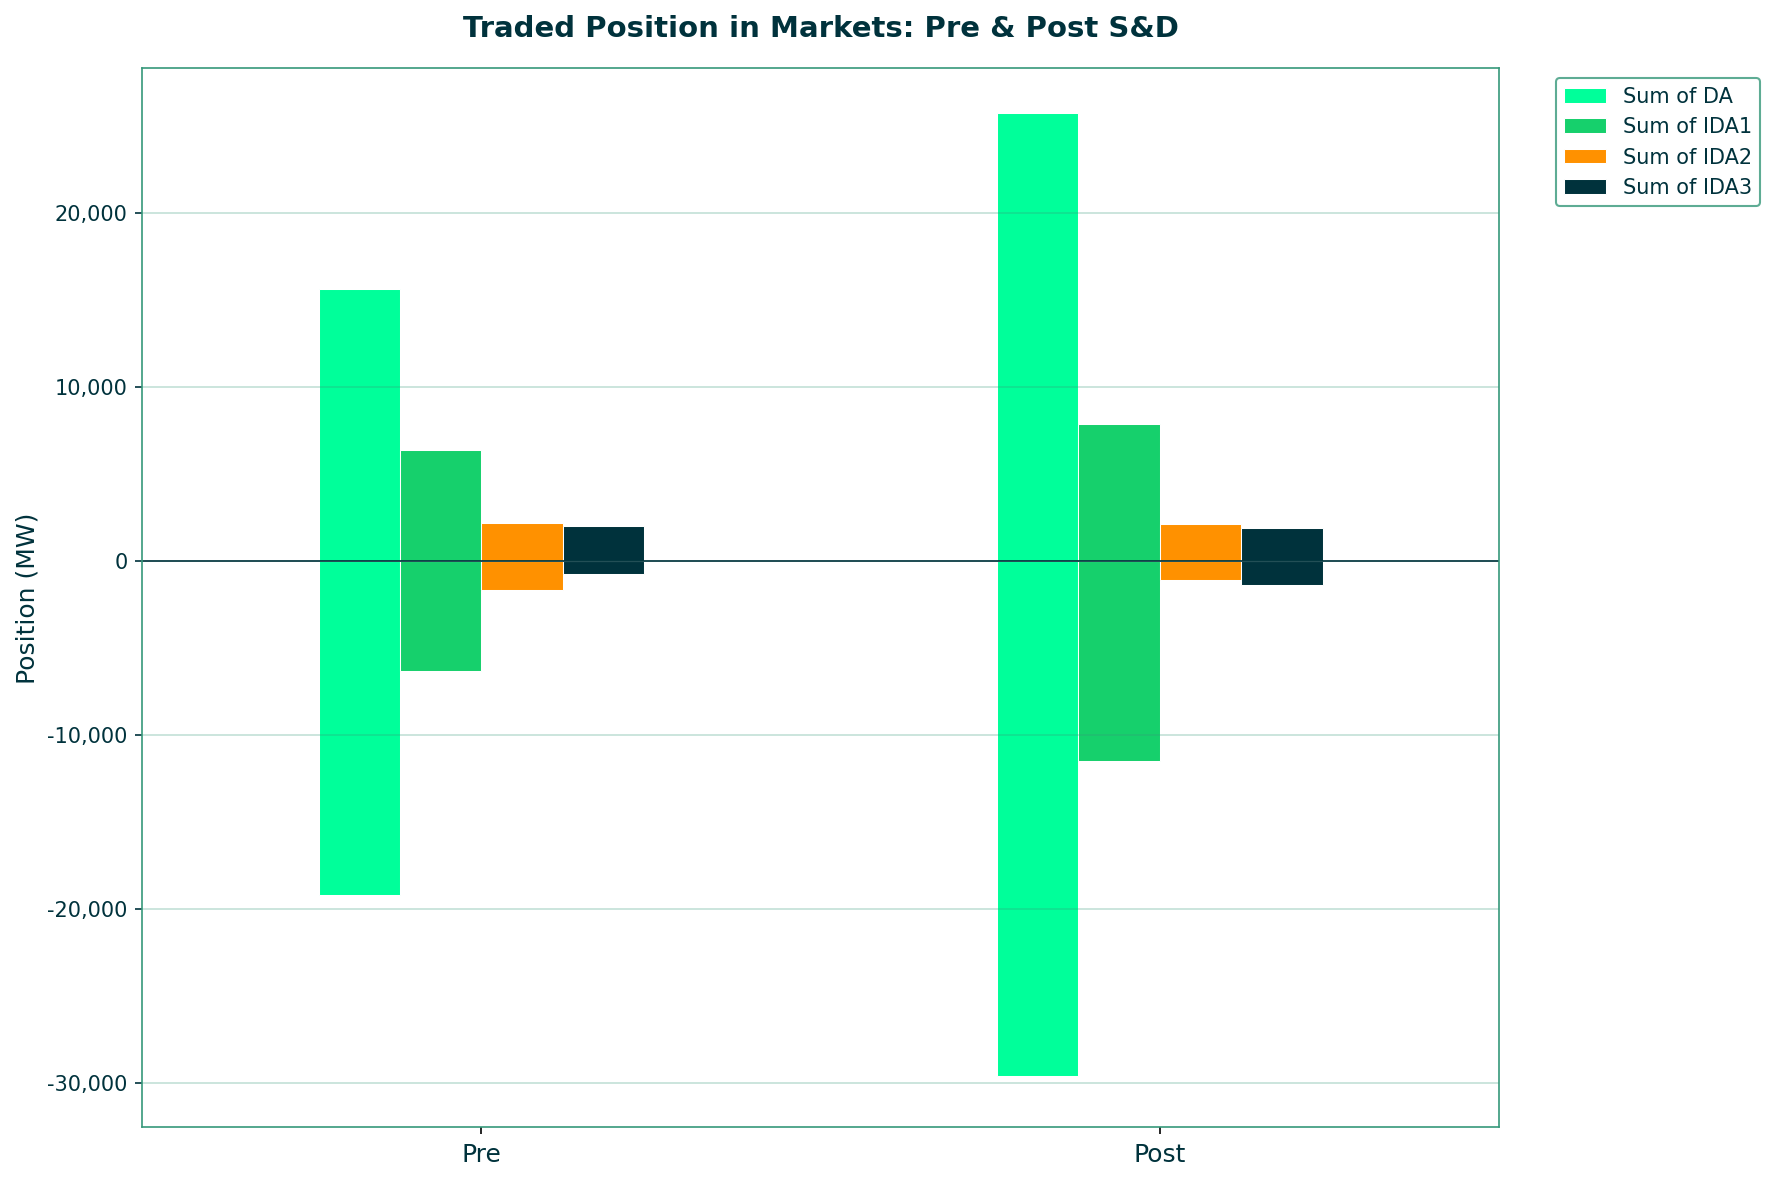
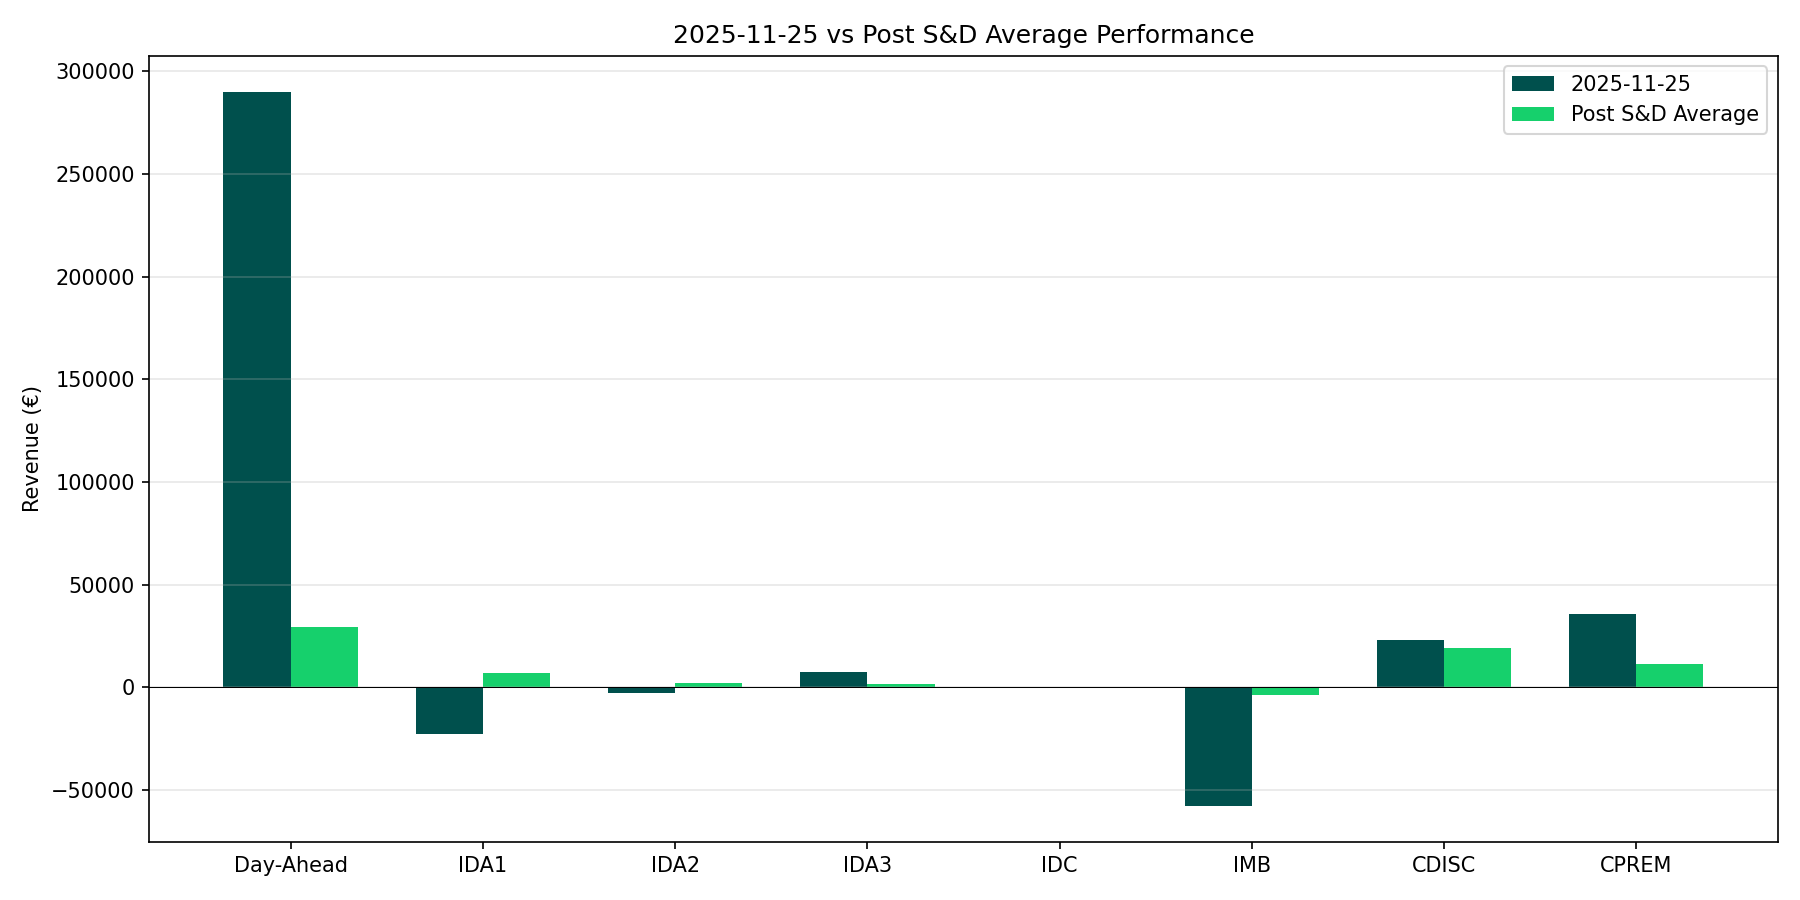
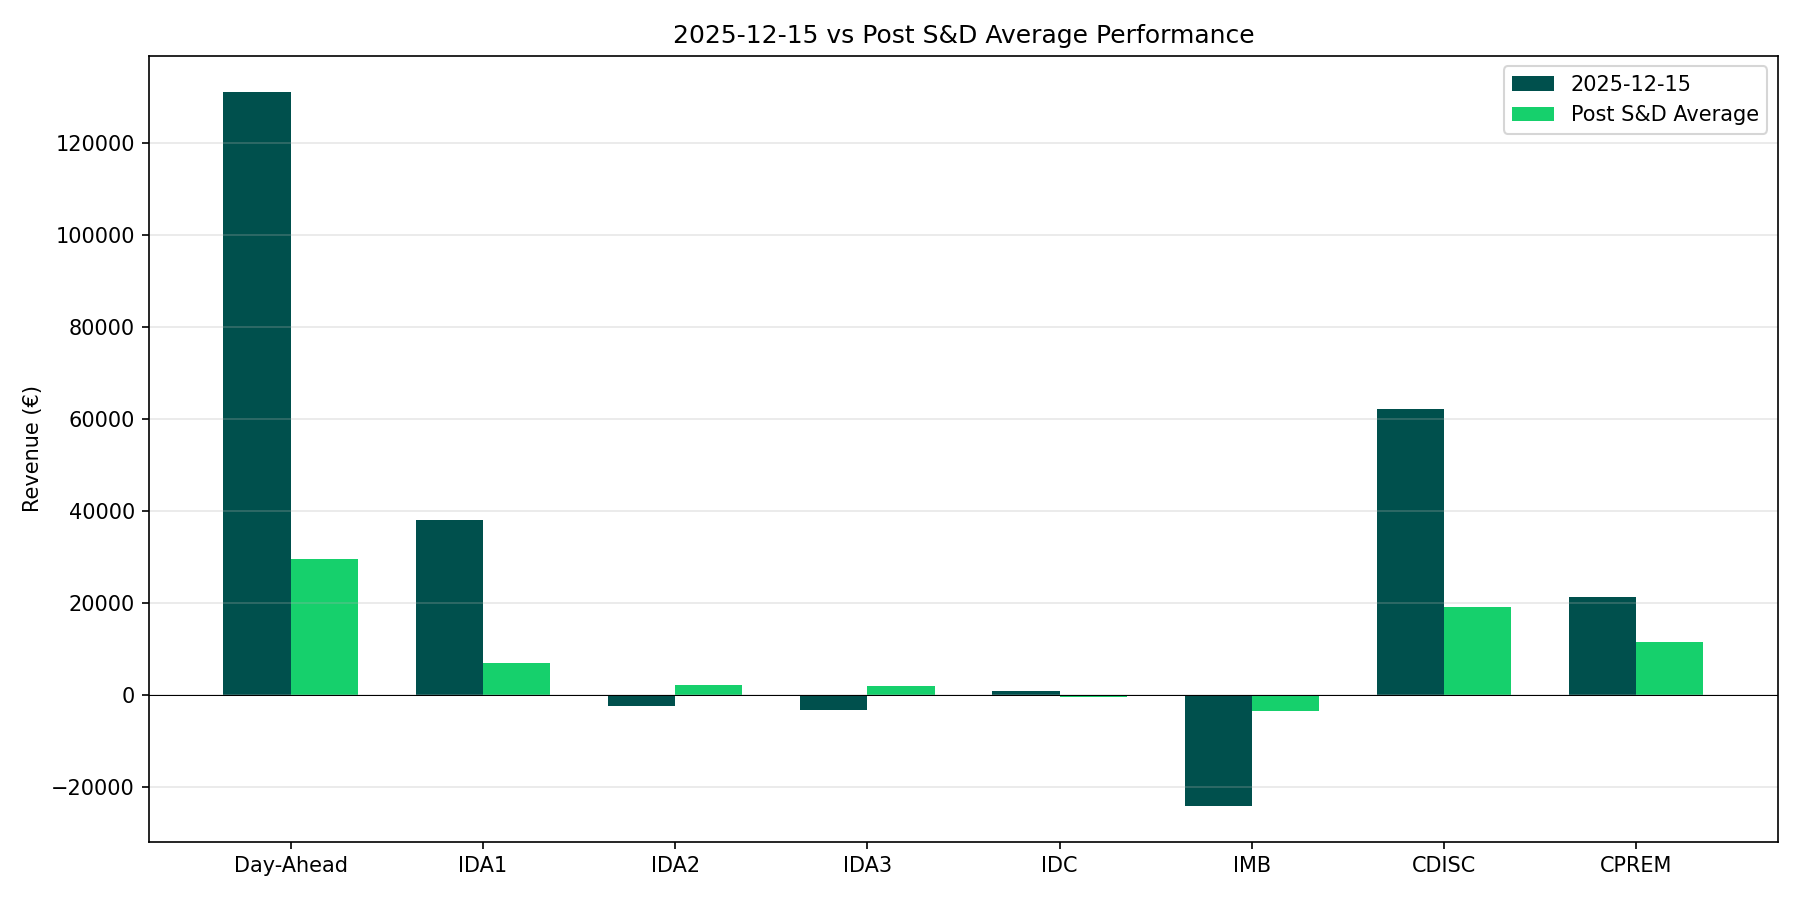
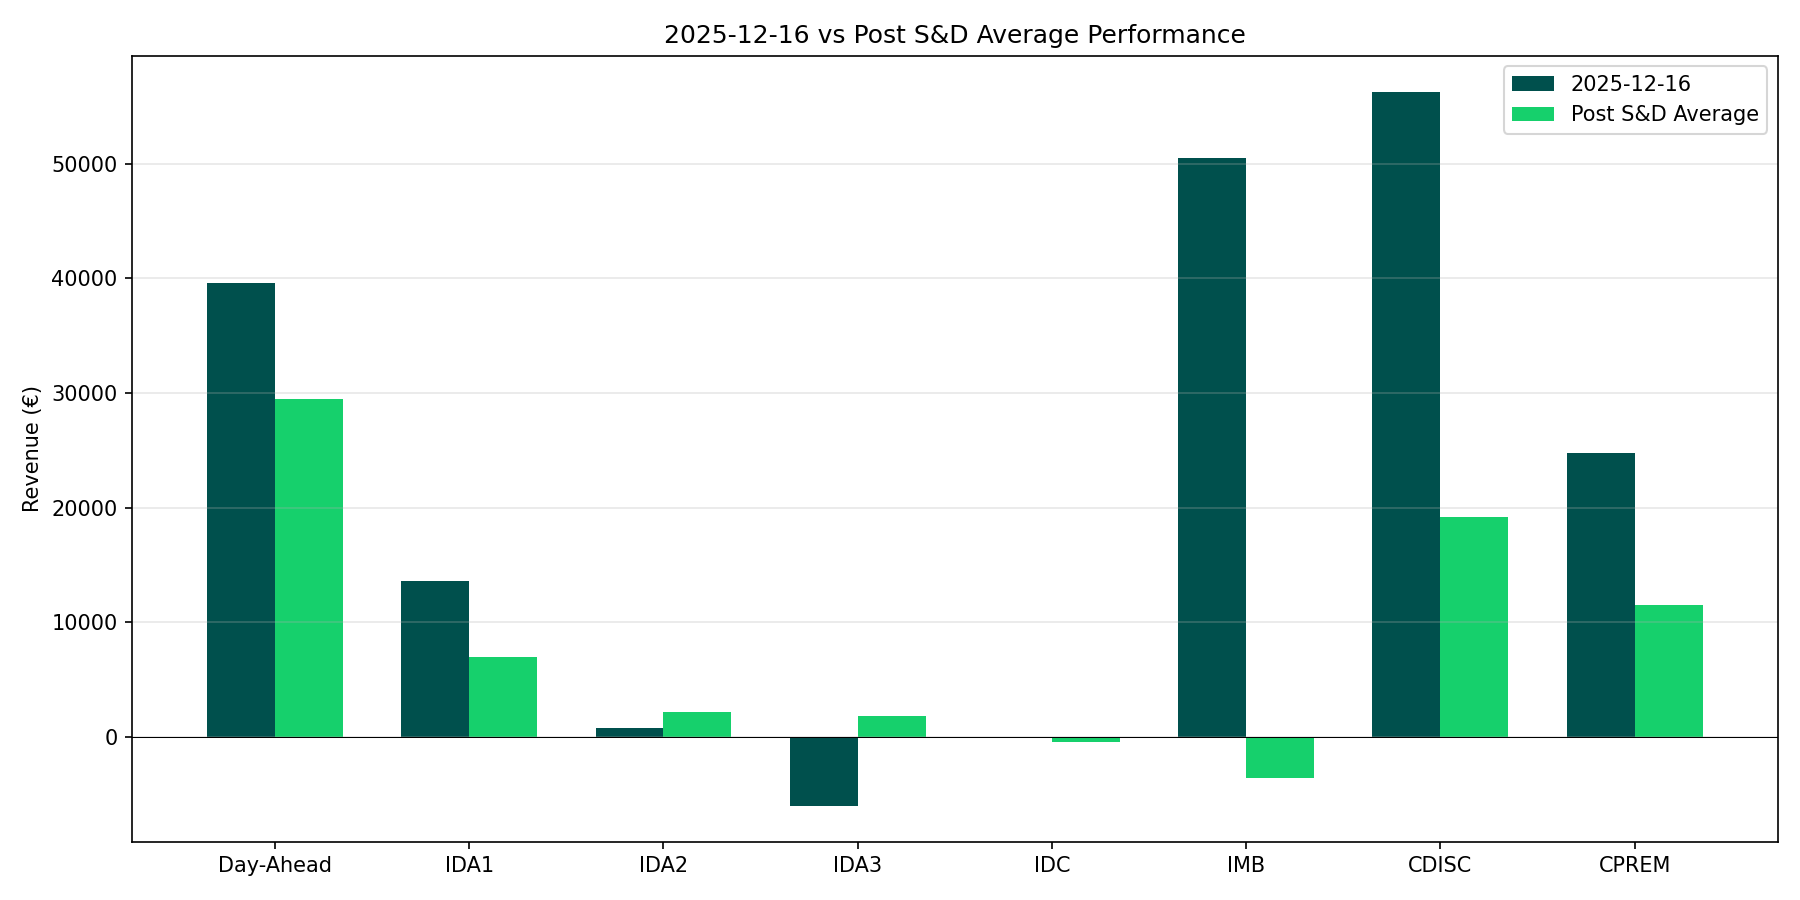
The below graphs show a breakdown of the different revenue streams over some of the most lucrative trading days since the implementation of S&D. The DA revenue stands out as the dominant source of revenue. However, revenue from the balancing market is higher than we would have expected based on the design of the S&D program and the implementation of ‘Follow PN’, with more on this later.
The following three graphs are the top three best days for the system as a whole in the post S&D period.
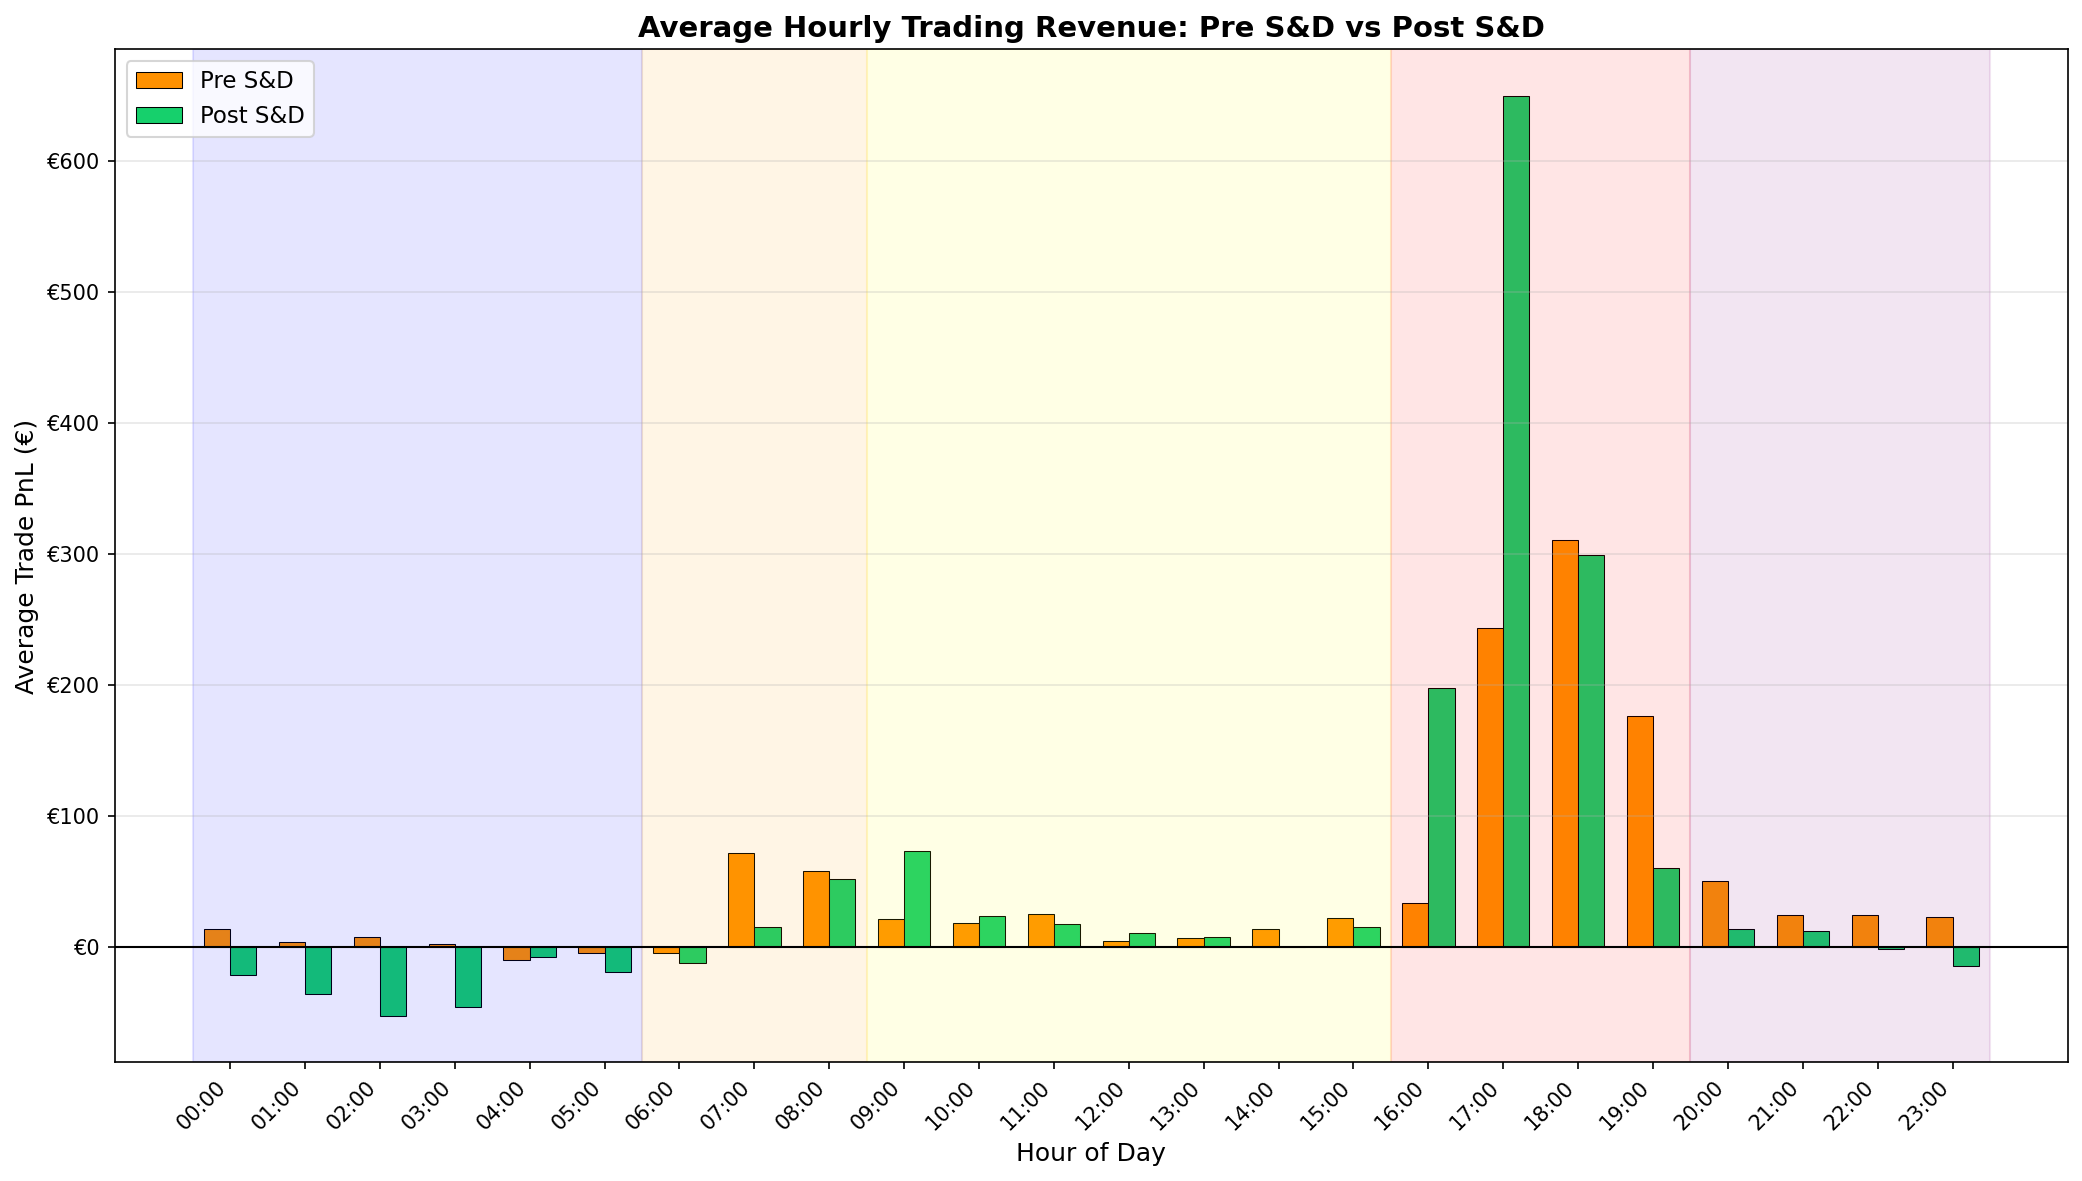
The post S&D period has seen an exaggeration of the existing evening trading peak for BESS units, and an increase in negative trading overnight, as units use low prices to charge.
This is not just a result of one optimiser or owner changing strategy but can be seen below to be across the storage sector (each row of squares is an individual asset).
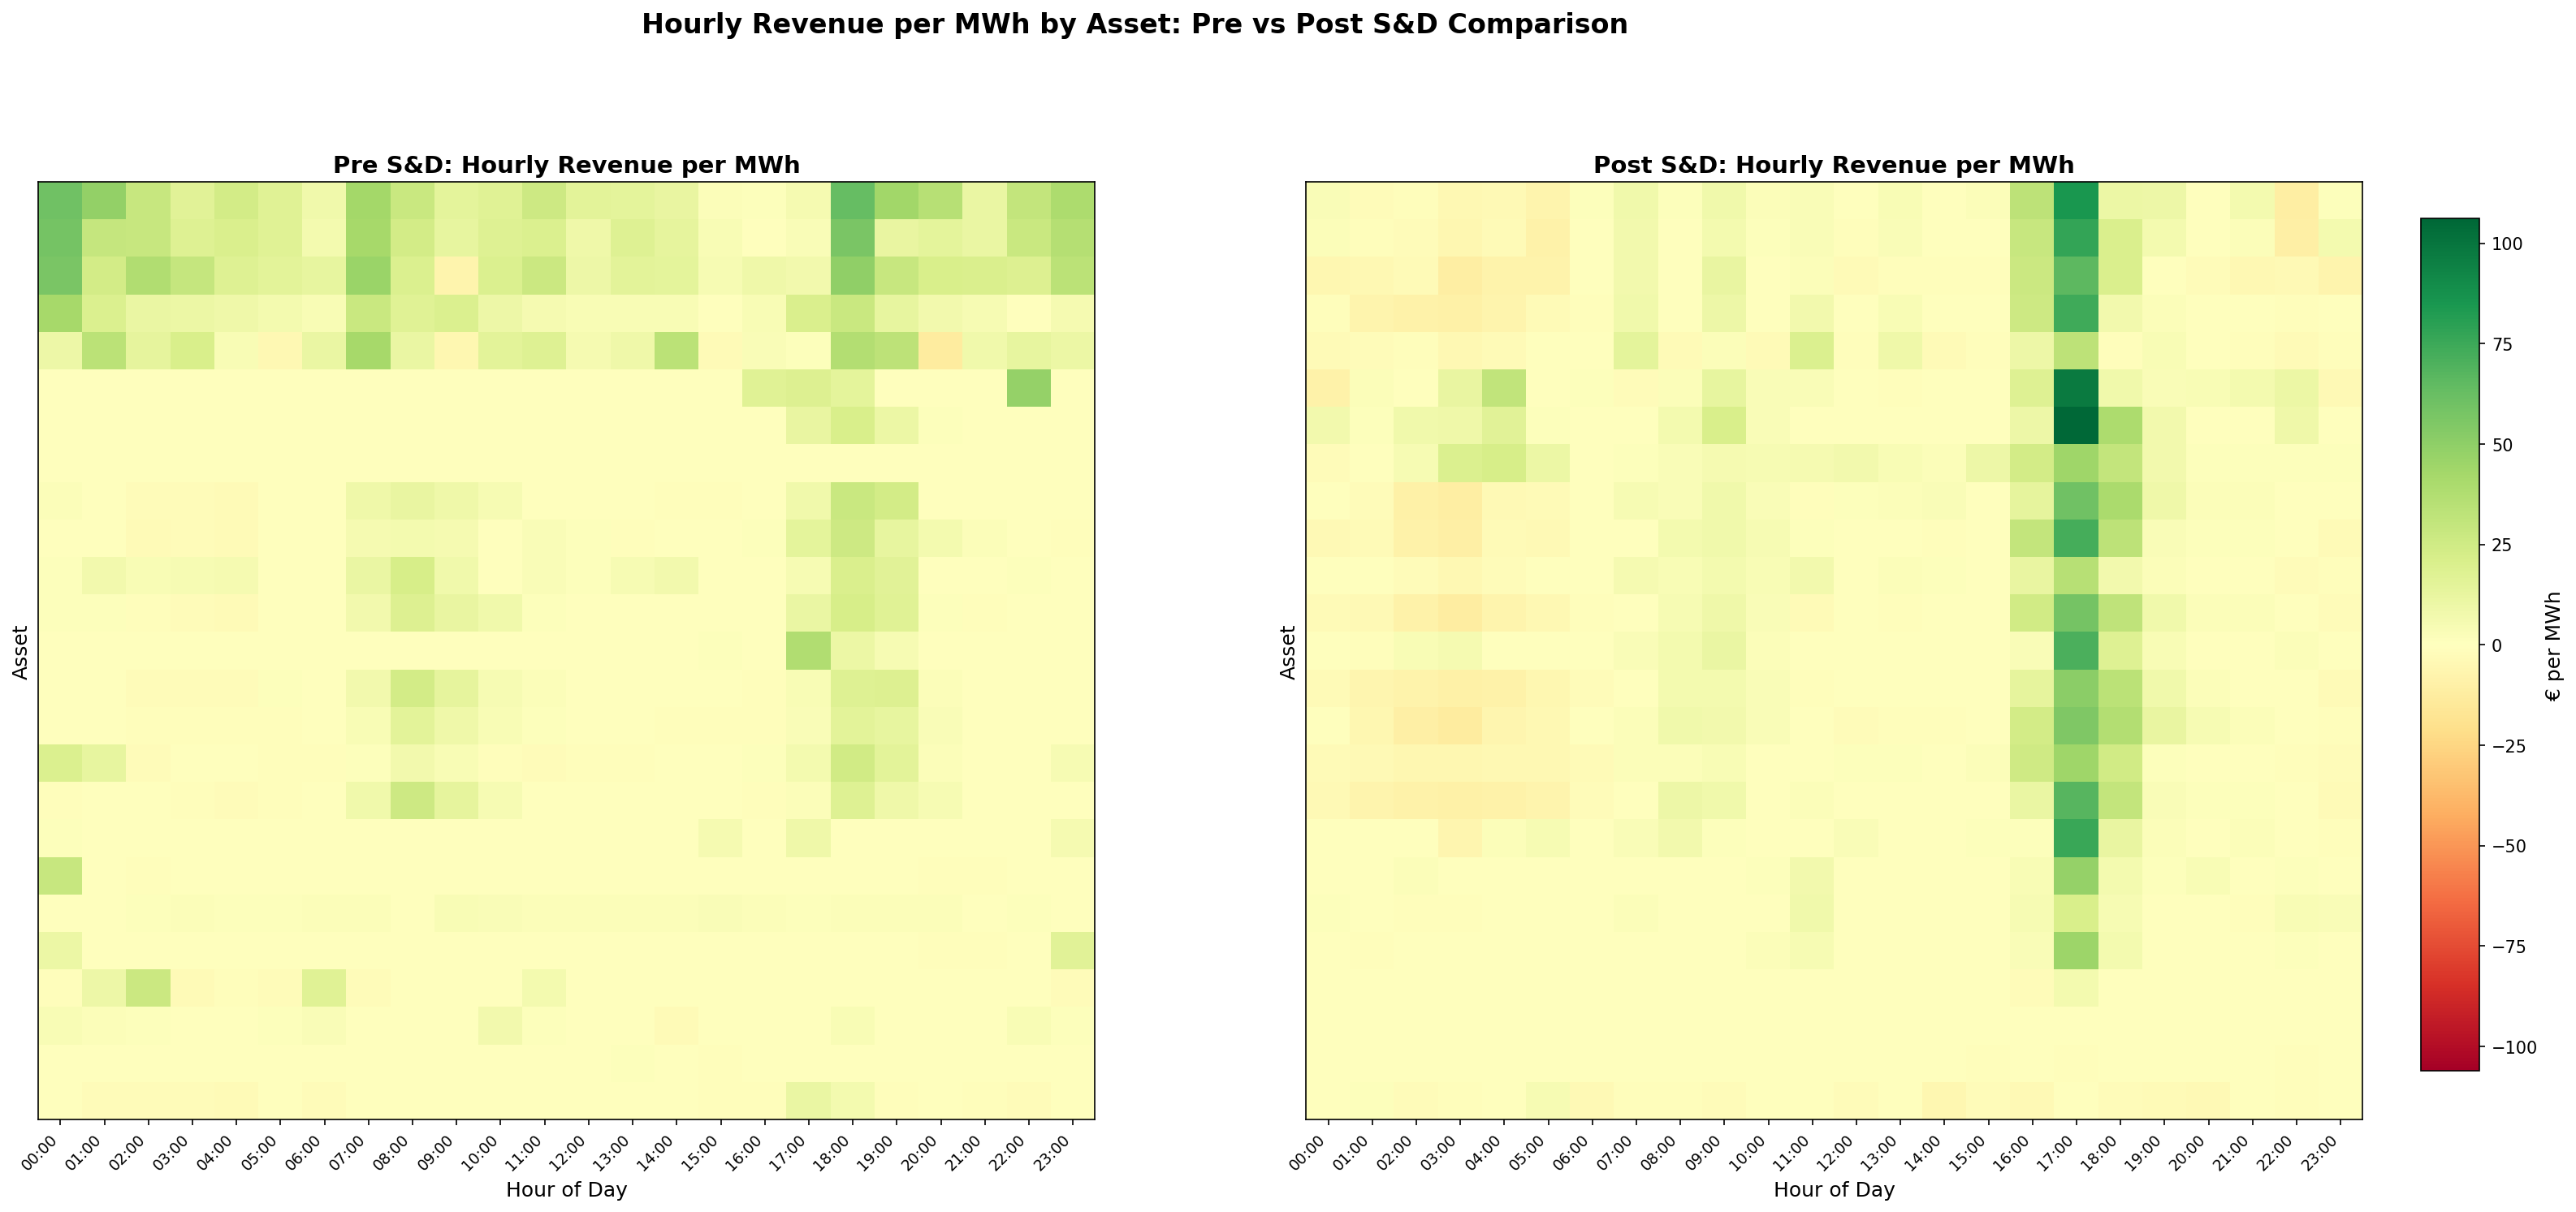
What can also be seen from the above graph is the greater engagement in trading revenue among assets that were not previously active in trading. Outside of the strong peak in the evening, the rest of the trading in the post S&D era is widely distributed through the day.
There are still assets that have not yet been trading regularly, totalling over 200MW of capacity that could become active in the market at any time. As highlighted earlier, it has taken time for optimisers of assets to fully engage with the post S&D changes, and the next 50 days and beyond will no doubt see continued adaption as trading teams grow more comfortable with the new framework. It is important to note that technical/warranty/availability constraints on BESS assets can sometimes play a factor in the trading strategy.
For the portfolio of assets at or above 2 hours of energy storage duration, we estimate that the expected annual trading revenue to be €44k/MW/Year, over the first 50 days of trading post S&D. This is supplemented by additional capacity market revenue and the currently lucrative ancillary service revenue making the return for Irish storage very attractive at present.
Follow PN
The industry is closely monitoring how EirGrid run BESS assets based on their traded PN as the Follow PN concept was at the core of the proposed S&D system change. Sold positions took a big jump – rising by 39%, since S&D was delivered. This has resulted in an equivalent high increase in the metered output with a 46.6% increase in discharged energy. This indicates that batteries are being utilised more frequently. However, BESS assets are only being run to their traded discharge position 80% of the time since the implementation of S&D, this is a marginal improvement from 77% of the time prior to the delivery of the new system.
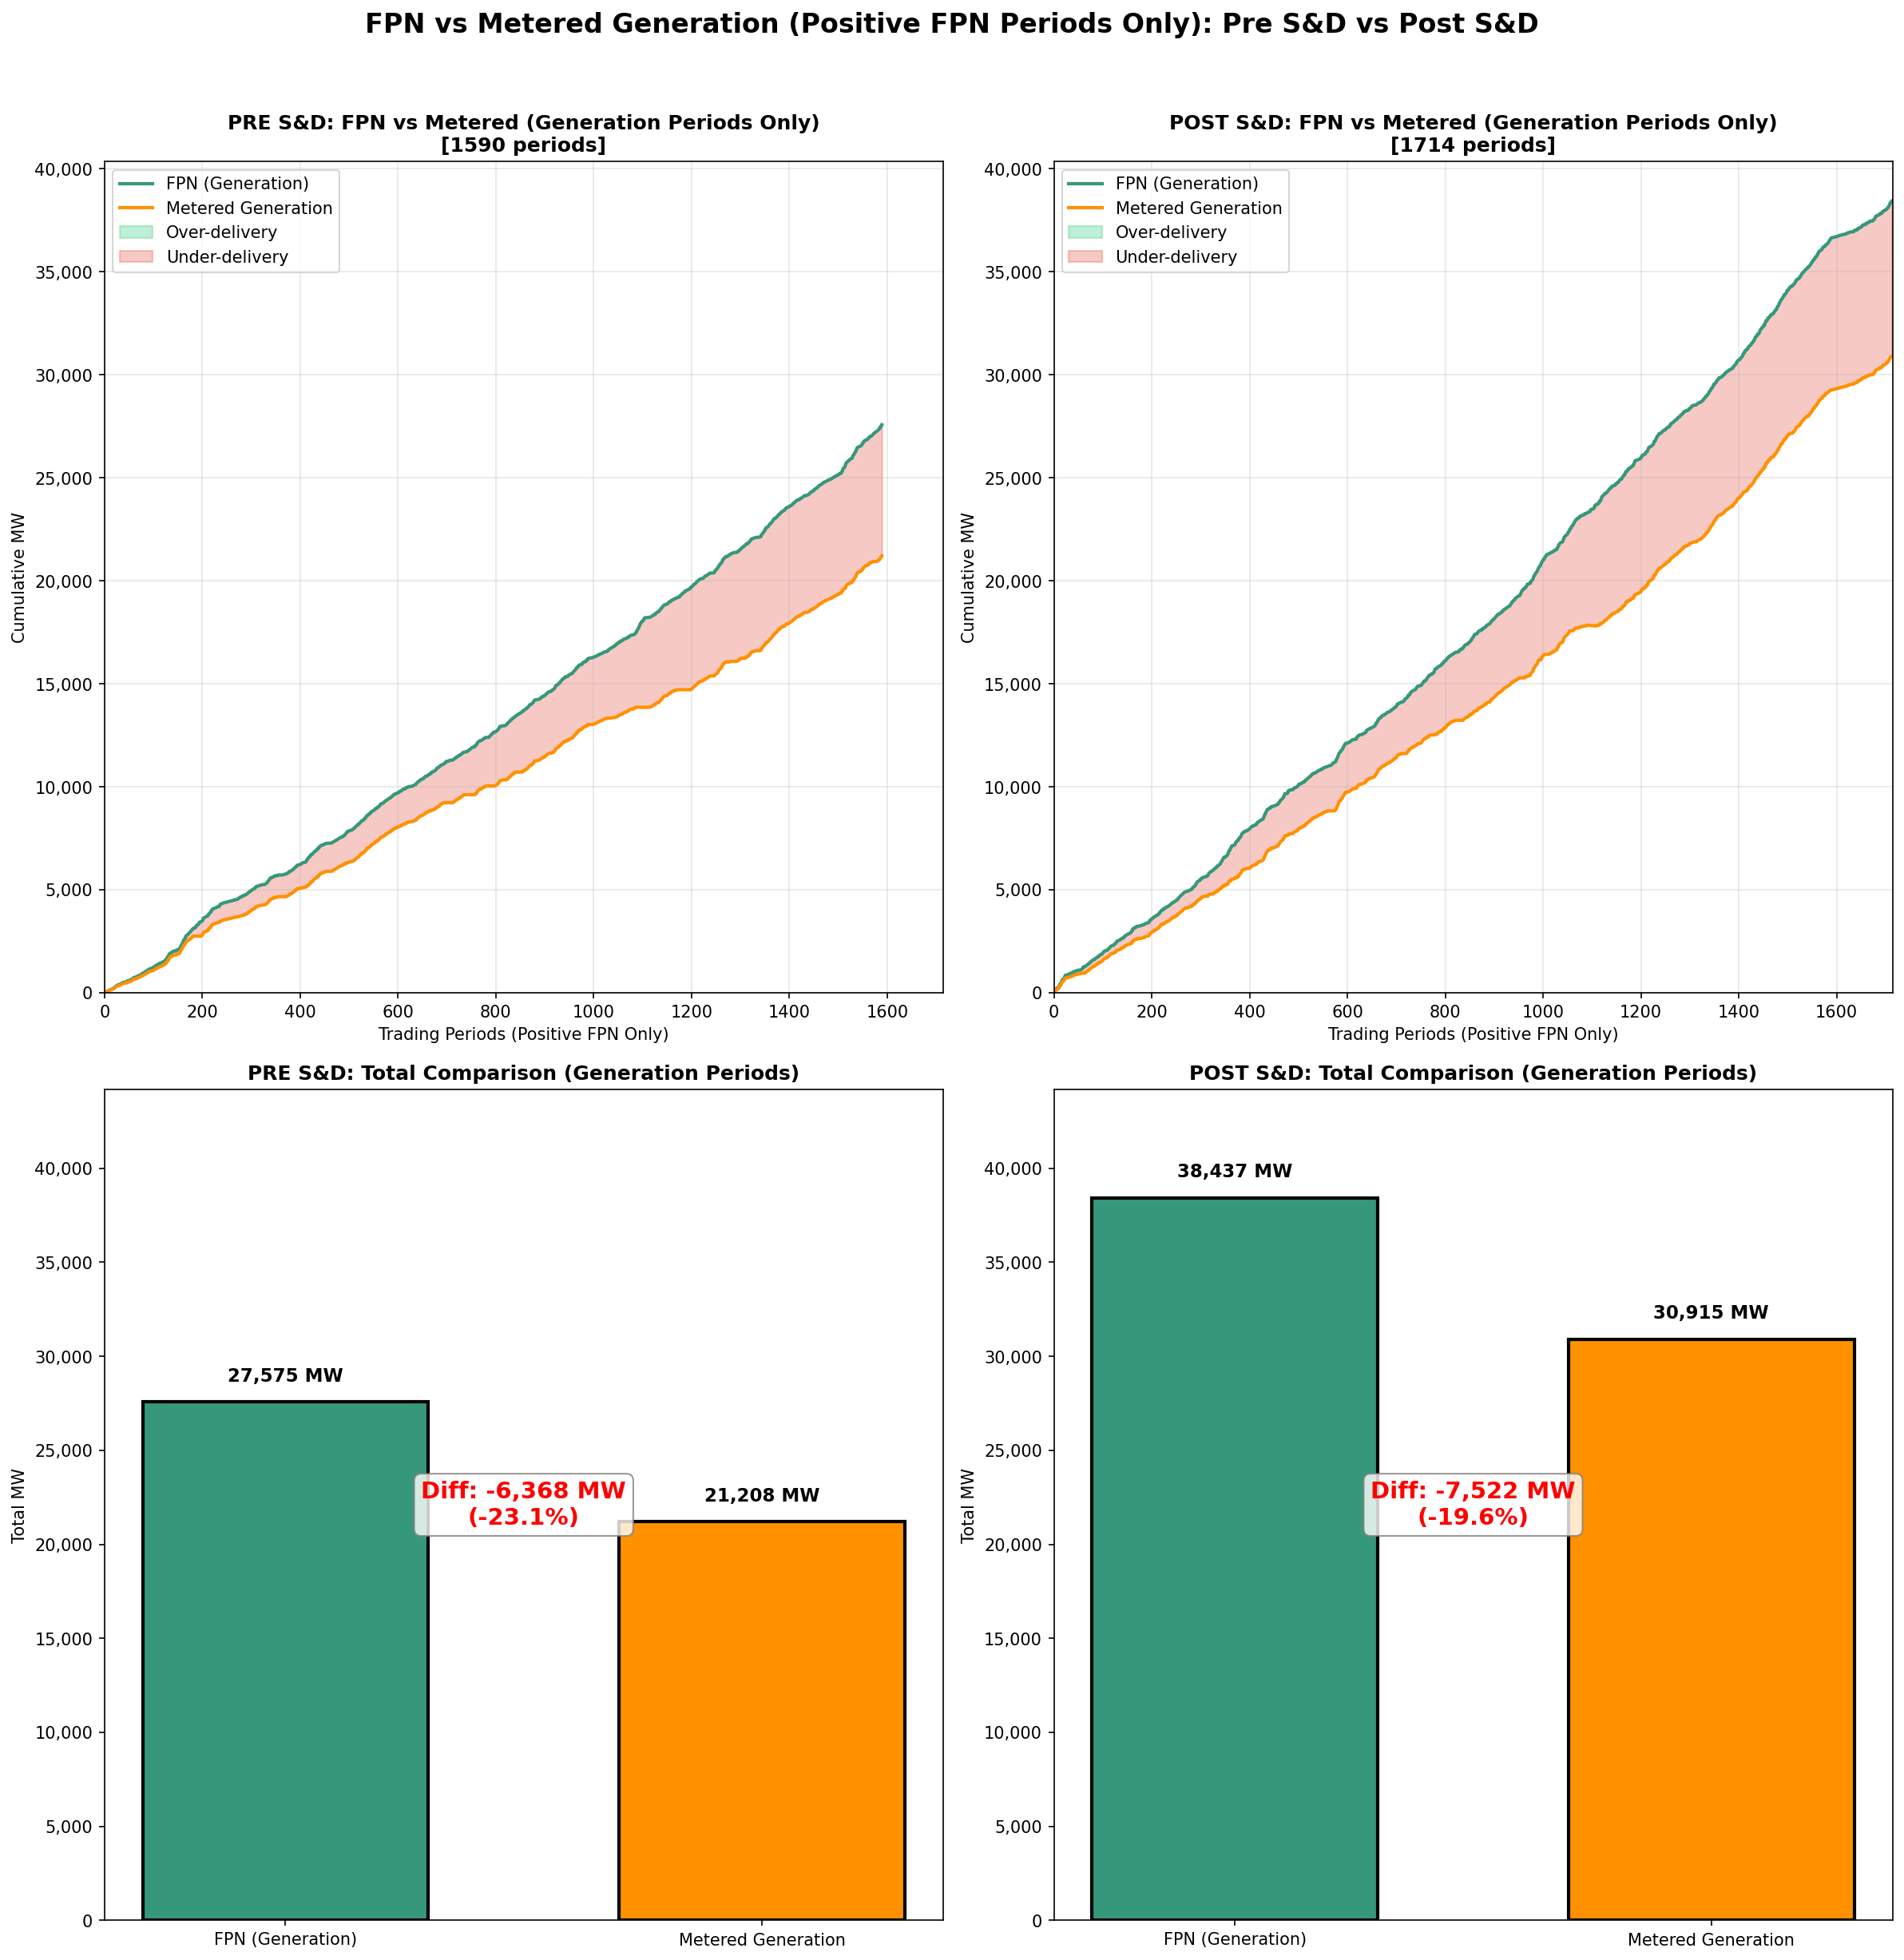
This was predominately driven by the introduction of a new, unexpected, constraint which was applied against BESS assets by EirGrid that limited asset ability to charge to 20% of their Maximum Import Capacity (MIC). This has a direct impact on an assets ability to meet its discharge position later in the day.
Assets have met 72.5% of their accumulative charge profile since the implementation of S&D. While this has a significant impact on an assets ability to efficiently capture arbitrage opportunities, it does provide balancing market as the asset is effectively been moved up from its PN. However, due to the non-firm status of a significant share of the BESS portfolio, the asset is exposed to an imbalance charge during the discharge profile later in the day. This is a complex trading scenario that need to be managed appropriately to ensure the asset achieves positive trading revenue while maintaining warranty obligations under a trading service agreement.
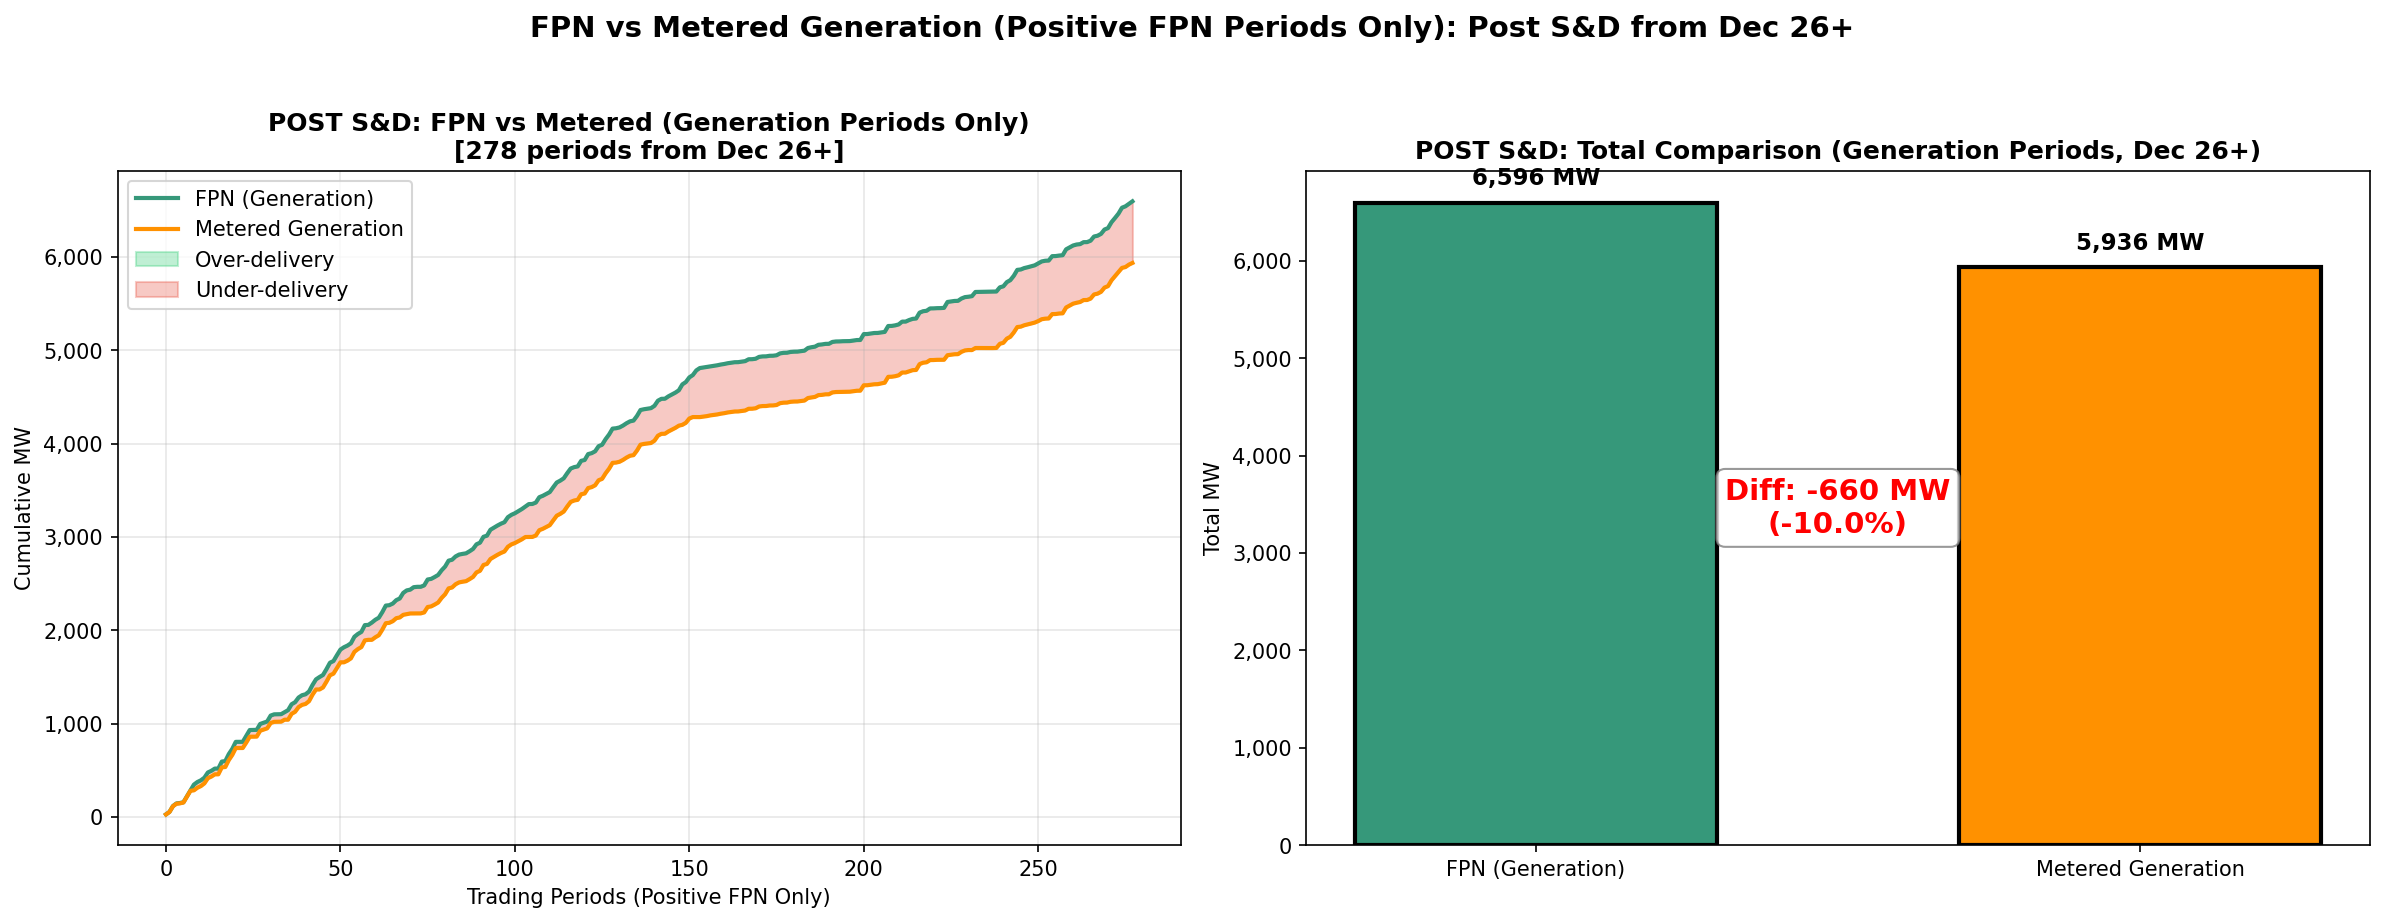
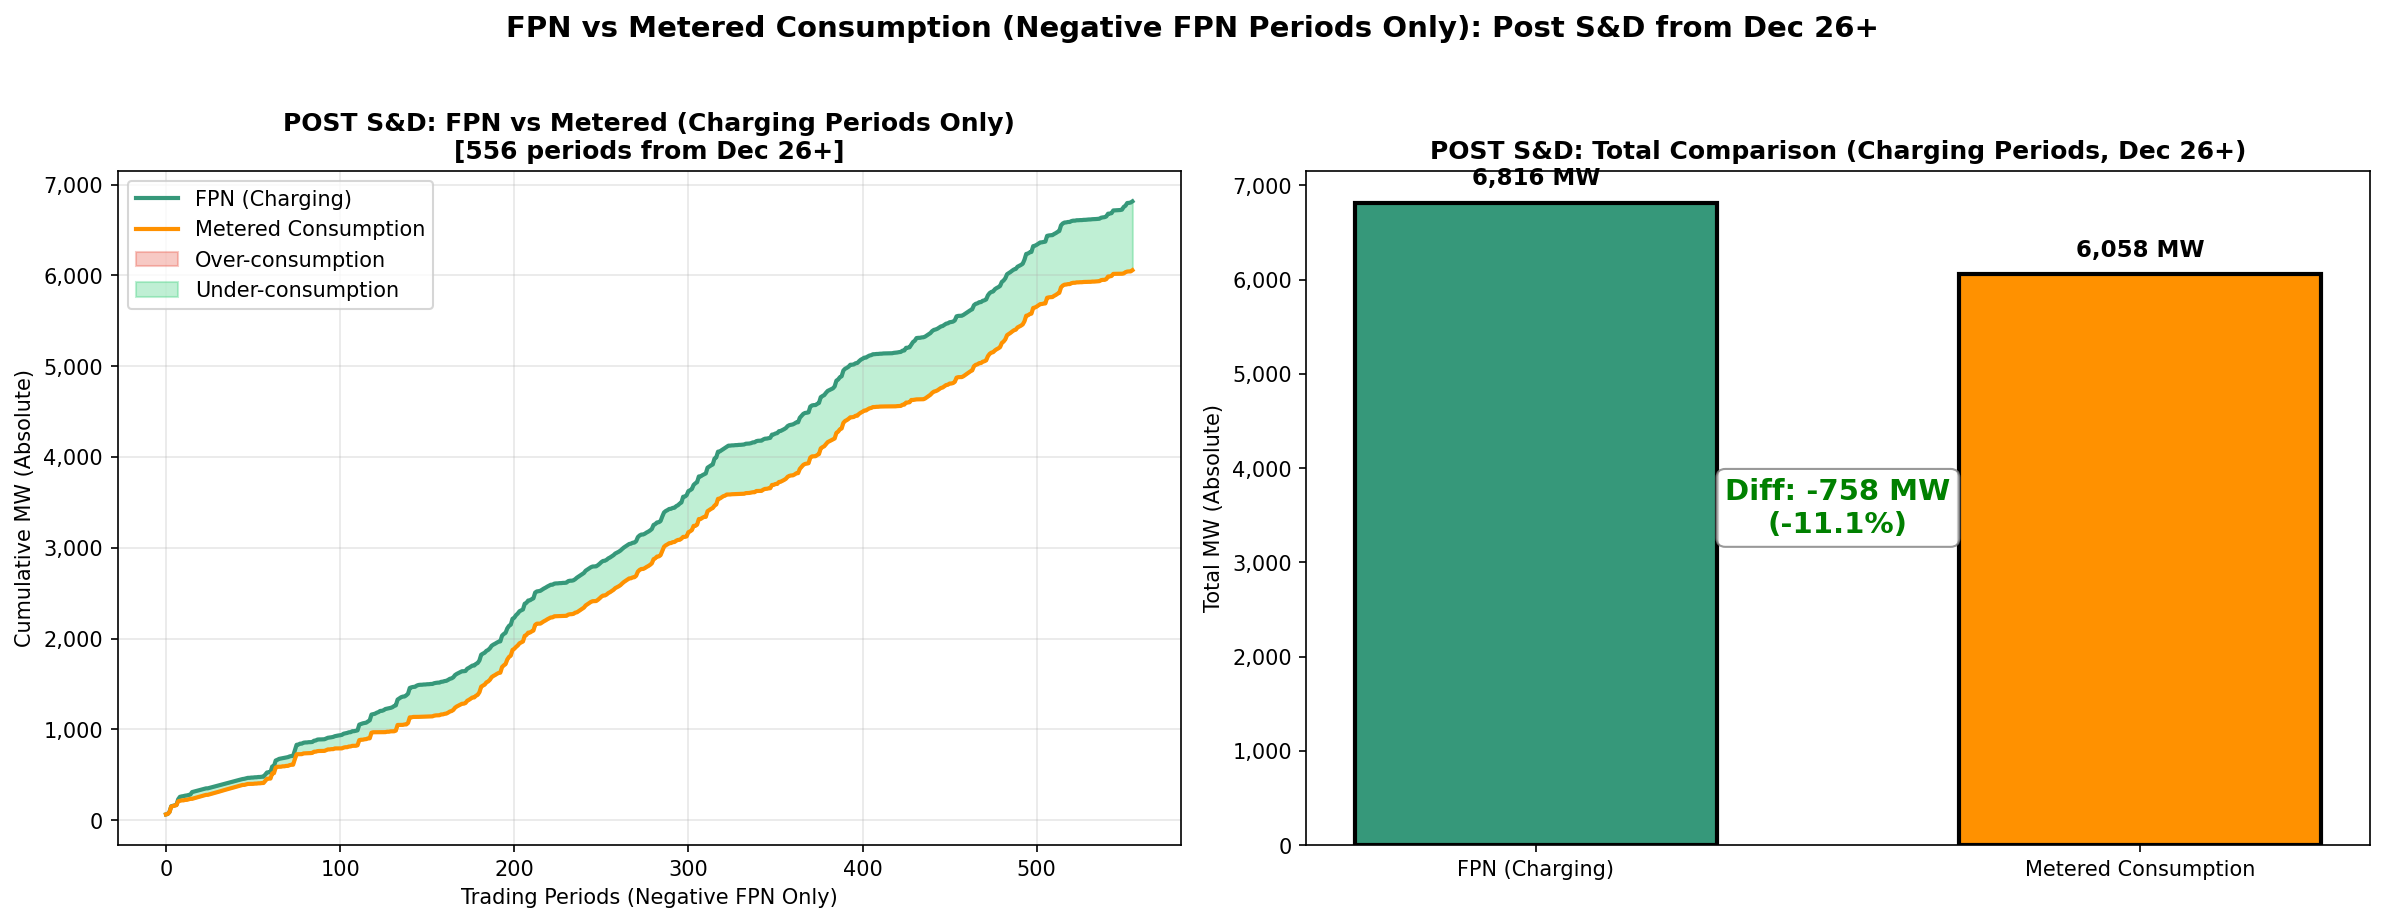
Similar to what was seen in GB with the introduction of the open balancing platform at National Grid, it has taken EirGrid some time to get comfortable with the increased operations of BESS assets on the system. EirGrid continues to manage an increasingly complex system with high levels of renewables and an increasing share of demand coming from a small cohort of large energy users causing their own unique challenges. Despite this, EirGrid have move relatively quickly to adopt their operational processes around the 20% MIC constraint and have now adopted a group wide constraint that looks to constrain charge volumes only when the cumulative BESS charge profile exceeds 200 MW in a given period.
As a result, we continue to see an increased improvement in how closely EirGrid run BESS asset to their traded position since the 26th of December, with both the charge and discharge profile being followed close to 90% of the time. This is a strong sign that market operators are making an effort to ensure that units are meeting their traded position, a positive outcome for the BESS industry.
What’s Next?
With DS3 set to continue until the earlier of (i) the implementation of the Day Ahead System Services Arrangements (DASSA) or (ii) September 2027, we expect ancillary service to continue to dominate the revenue stack. A decision has yet to be made on the Temporal Scarcity Scalars (TSS) that are a key driver in the high returns seen in DS3, by increasing the payments by a magnitude when SNSP is high. The removal or reduction of the these scalars can be implemented within a month of a final decision from the SEM Committee, which would have a significant impact on DS3 revenue and would result in a major shift in battery trading towards wholesale trading. At the moment, TSS levels, particularly across the evening peak, are a significant variable on the likelihood of batteries trading for the day.
The removal of these scalars will reduce the importance of SNSP, and result in traded revenue rising as a percentage of income.
The implementation of the Follow PN approach will continue to be monitored closely by the market as a key indicator in determining future BESS revenue. Battery developers are keenly awaiting more information on the Enduring Solution for batteries that EirGrid is currently developing. This will give more access to the Balancing Market for BESS assets, unlocking a key element of the revenue stack in the Irish market.
Further, the future of ancillary service looks unnecessarily complex; the industry would benefit from finalising the design of the proposed DASSA auction so that future revenue can be accurately forecasted.
While it is still early days to assess the full success of the S&D program for BESS assets, it is finally a step in the right direction and a positive sign for the market as a whole to see the increased activity of BESS assets in the market.
ElectroRoute is an active participant in the storage sector in Ireland and GB, having contracted over 449MW of storage and flex assets since 2021. We have a 24/7 trading desk in Dublin to manage our assets. Our storage and flex originators have considerable expertise in the market and are always happy to talk Should you have any queries, or wish to get in touch, please reach out to our Commercial Manager at rory.cafferky@electroroute.com.