I-SEM in 2020
I-SEM in 2020
This market insight looks at the key trends and figures in I-SEM in 2020.
Generation Mix
As in previous years, natural gas fired generation led the way in power generation in 2020. An additional 5% of the generation mix was delivered by Wind units in 2020 over the previous year as it continued to increase its share. This contributed to I-SEM being a net exporter of power over the year. The limitation on exports over the Moyle interconnector was increased from 80MW to 250MW in December opening up the opportunity for wind to increase its output into the system.
The contribution from the coal units at Kilroot and Moneypoint was marginally higher than in 2019, while peat fired generation had a reduced presence in the mix. Generation at West Offaly and Lough Ree peat units was limited over the summer months due to environmental restrictions, and the two units closed permanently in December, removing 235 MW of dispatchable generation from the system.
Several operational constraints were introduced during the year to counter the impact of COVID-19 on the maintenance schedules of thermal units. These constraints on Dublin Bay, Huntstown 2 and two Ballylumford units managed the run hours of these units to reduce risks for margins across the 2020/21 winter period.
On several occasions in the second half of the year, the system operators on the island issued Amber Alerts, indicating tight generation margins, specifically that the loss of a large generation unit could result in the inability to meet demand. In previous years these alerts had been issued for Northern Ireland only, however many of the alerts in 2020 were for both jurisdictions.
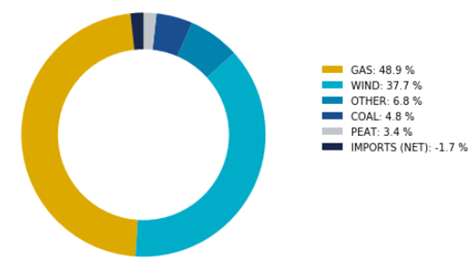
Figure 1: Generation Fuel Mix in 2020
Wind Performance
Wind generation started the year very strongly with a capacity factor of about 40% in Q1 and a new Irish wind output record of 4,259 MW was set in February. Overall, for 2020, the capacity factor for wind was approximately 28%. The volumes of wind generation dispatched down were considerable throughout the year. This wind, which was available but couldn’t be accommodated on the system due to local constraints and system wide curtailment, amounted to 12% of available wind generation. This was a marked increase on the previous year’s 8%. The driver of the increase in dispatch down volumes was largely due to high wind capacity factors and lower demand.
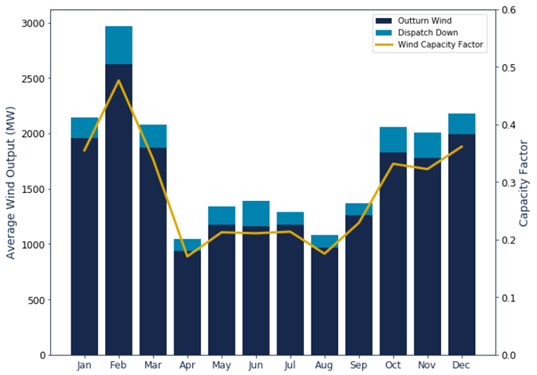
Figure 2: Wind: Outturn Generation, Dispatch Down and Capacity Factor
The system operators are continuously pushing the boundaries in how they operate the system and continued this in 2020, to allow greater volumes of wind and solar on the system. Two notable developments in this area were (i) the increased SNSP limit trial, which saw the system operators allow up to 70% of generation on the system to come from non-synchronous resources (a longer trial of this limit is currently ongoing), and (ii) an easing of the 400kV constraint group so that only in scenarios where system wind is below 1GW is a unit under this constraint group required to be running. The increased export capacity over the Moyle interconnector and the reduced minimum generation level of Coolkeeragh CCGT unit also facilitates further wind and solar on the system.
The following table shows the relationship between wind generation and market prices. It shows the average day ahead market (DAM) price and the average balancing market (BM) price on the 10 highest and 10 lowest wind generation days. As expected, the volume of available wind has a significant impact on the DAM price.
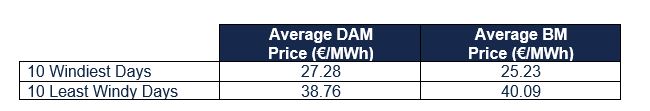
Table 1: Market Prices on the 10 highest and 10 lowest wind generation days
Demand
The graph below shows the average all-island daily demand per month in 2018, 2019 and 2020. The start of the year saw a strong demand for power, followed by a sharp drop from late March following the introduction COVID-19 related lockdown measures. These measures continued to deflate system demand until the middle of June when the lockdown measures were eased, and the economy started to reopen. The effects of lockdown were seen again from late October for several weeks when the Irish government introduced level 5 restrictions. Demand bounced back strongly in December following the temporary easing of some lockdown measures.
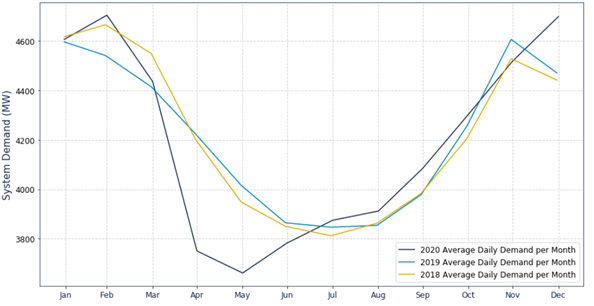
Figure 3: Average Daily Demand per Month in 2018, 2019 and 2020
Commodity and I-SEM Power Prices
The graph below shows the average DAM prices for 2019 and 2020, and the daily averages. There was a considerable drop in the average DAM price in 2020 compared to 2019 due to a combination of lower demand and lower commodity prices. In terms of DAM prices, the highest price reached €378/MWh while the lowest was €-41/MWh, which was one of a total of 381 hours in which the DAM price was negative. Another first in 2020, was a negative baseload price (average price) in DAM which occurred on April 5th and reoccurred on a further 3 days, all of which were during the first COVID-19 related lockdown.
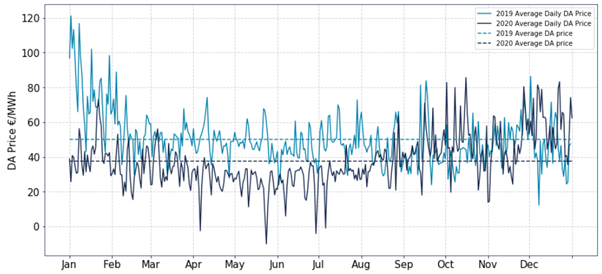
Figure 4: Average Day Ahead Market Prices in 2019 and 2020
The large volatility in the balancing market (BM) saw prices range from €-390/MWh to €691/MWh. That high price, which breached the capacity market’s reliability option strike price, occurred on a day when an amber alert was issued – check out this insight for more information on that event. The imbalance price was negative for a total of 1099 settlement periods (30 min periods).
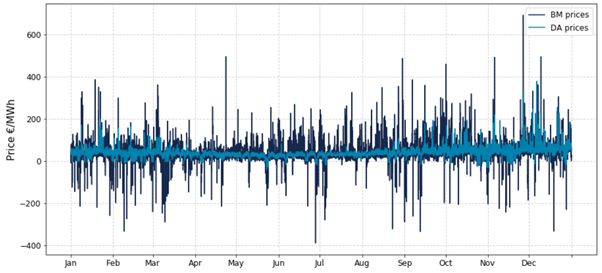
Figure 5: Day Ahead Market and Balancing Market Prices in 2020
On the commodities front the impact of COVID-19 is also evident, particularly on gas and carbon which are key drivers of the DAM price. Coal has been relatively flat throughout the year. Carbon fell considerably as lockdown measures were introduced throughout the EU in March but recovered steadily and closed the year strongly by reaching an all-time high above €31 a tonne in December.
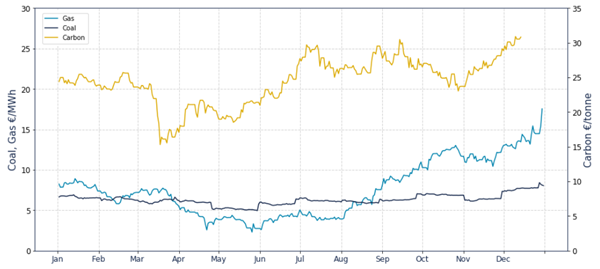
Figure 6: Carbon, Coal and Gas prices in 2020
The start of 2020 saw gas prices continue to fall due to strong supplies with increased availability of LNG, a warmer than average winter 2019/20 and demand reductions caused by the economic impacts of COVID-19. In May, European gas markets traded at all-time lows and the UK’s NBP day-ahead contract traded as low as 6.5 p/th, more than 30 p/th lower than the 5-year average for this time of year. The year ended with gas prices finishing strongly with cold weather forecasts and a tight LNG market driven by strong Asian demand. This insight delves into the dynamics of LNG in 2020.
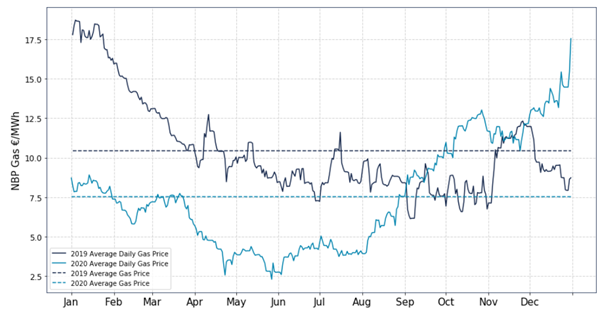
Figure 7: Average NBP Gas Prices in 2020
Outlook
Already in the first few weeks of 2021, I-SEM has delivered several new records, with a new DAM price record and wind generation levels passing the record set in February 2020. One significant point is the impact of Brexit on I-SEM – in this insight we summarise the first month post Brexit. A cold weather spell combined with thermal units on forced outages have led to tight system margins. High volatility in gas and carbon prices have continued into 2021.
Please contact our Client Services team if you would like to explore the trading, forecasting and balancing services that ElectroRoute can offer to allow you to mitigate the risks or maximise the opportunities of your assets.